
Fig. 11
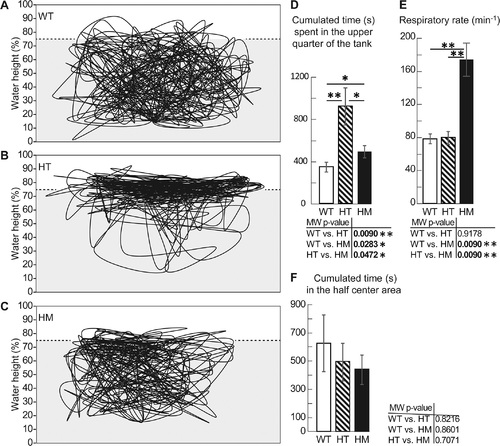
The 9 mpf col6a1ama605003 mutant fish presented a hypoxia behavior. We video-recorded for 30 min (25 frames/sec) and tracked the swimming trajectories in the vertical plane of WT, HT and HM col6a1ama605003 fish at 9 mpf in a tank. The position of the fish every 6 sec (1 frame every 150 frames) was plotted. A representative trajectory of each genotype is presented, WT (A), HT (B) and HM (C). From these videos (n = 5 of each genotype) the cumulated time fish swam in the upper quarter of the tank (D) was calculated and was significantly different between WT and HT (p-value 0.009), WT and HM (p-value 0.0283) and HT and HM (p-value 0.0472). HT and HM mutants spent visibly more time in the oxygen-richer part of the tank. The respiratory rate (oral/opercular movements, min-1) was determined for mutants and controls, n = 5 (E) and this rate was significantly different between WT and HM (p-value 0.009) and HT and HM (p-value 0.009). As a test for centrophobia, we measured the time fish spent in the centre of the tank in the horizontal plane. The centre corresponds to the half centre area of the tank. There was no difference of occupancy between the three genotypes. n = 15, 19 and 7 for WT, HT and HM respectively. For each histogram, a Mann-Whitney test was performed; *, ** indicate p-values of < 0.05 and < 0.01 respectively. |
| Fish: | |
|---|---|
| Observed In: | |
| Stage: | Adult |