
FIGURE
Fig. S10
- ID
- ZDB-FIG-151019-6
- Publication
- Mirando et al., 2015 - Aminoacyl-tRNA synthetase dependent angiogenesis revealed by a bioengineered macrolide inhibitor
- Other Figures
- All Figure Page
- Back to All Figure Page
Fig. S10
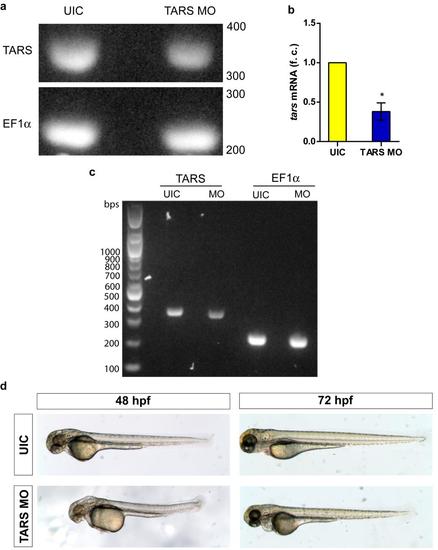
Depletion of TARS elicits a similar vascular phenotype to BN and BC194 inhibition. (a-b) RT-PCR (a) and RT-qPCR (b) of trizol/chloroform extracted mRNA from uninjected controls (UIC) and TARS morphants (MO) validate the reduction of TARS levels by morpholino injection. (a) Whole fish mRNA (48 hpe) was amplified by RT-PCR with gene specific primers. The TARS (338 bp) and EF1a control amplicons were run on 1.5% agarose to show differences in relative intensities between uninjected controls (UIC) and morphant fish. (b) cDNA was generated from isolated mRNA using oligo-dT primers and the tars expression relative to EF1α was determined by the ΔΔCT method; mean ± SEM, n=2, *p<0.05 relative to UIC (unpaired t-test). (c) Full size gel for image shown in a. (d) Whole body images of UIC and TARS morphant fish at 24 and 48 hpe. |
Expression Data
Expression Detail
Antibody Labeling
Phenotype Data
Phenotype Detail
Acknowledgments
This image is the copyrighted work of the attributed author or publisher, and
ZFIN has permission only to display this image to its users.
Additional permissions should be obtained from the applicable author or publisher of the image.
Full text @ Sci. Rep.