
- Title
-
Aminoacyl-tRNA synthetase dependent angiogenesis revealed by a bioengineered macrolide inhibitor
- Authors
- Mirando, A.C., Fang, P., Williams, T.F., Baldor, L.C., Howe, A.K., Ebert, A.M., Wilkinson, B., Lounsbury, K.M., Guo, M., Francklyn, C.S.
- Source
- Full text @ Sci. Rep.
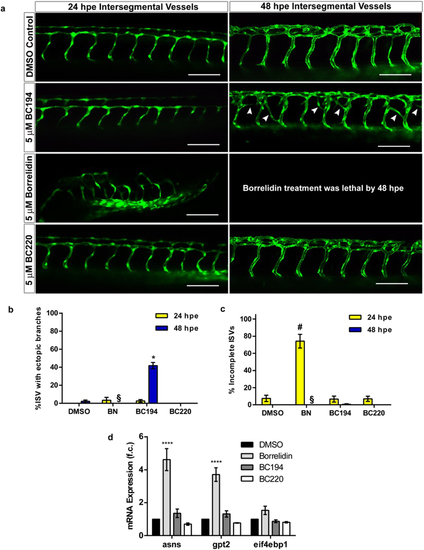
Exposure to BN and BC194 results in vascular defects and mis-patterning. (a) Representative confocal images (20x magnification) of zebrafish ISVs at 24 and 48 hpe. Zebrafish embryos were incubated in egg water at 25 °C until 8–12 somites of age. The embryos were then manually dechorionated and incubated in egg water containing the indicated compounds at 28.5 °C until the images were taken. Calibration bar represents 100 µm. (b,c) Quantification of ectopic branching (b) and aberrant patterning (c) of ISVs. Embryos were incubated with the indicated compounds (5 µM) or DMSO until images were taken by fluorescent microscopy at 24 and 48 hpe. Aberrant structures were then counted within a region encompassing 5 ISVs anterior and posterior from the end of the yolk extension; mean ± SEM, n ≥ 8, #*p < 0.0001 relative to DMSO at 24 and 48 hpe respectively (one-way ANOVA, Tukey Test). ‡BN-treated fish rarely survived to 48 hpe. (d) RT-qPCR values for the expression amino acid starvation response genes asns, gpt2, and eif4ebp1. Dechorionated embryos (15 somites) were incubated in egg water containing the indicated compounds for 24 hours. Total RNA was extracted by trizol/chloroform and the expression levels relative to actb were determined using the ΔΔCT method; mean ± SEM, n = 3, ****p < 0.0001 relative to DMSO (two-way ANOVA, Tukey Test). See Supplementary Figure S7 for physiological and toxicity information. |
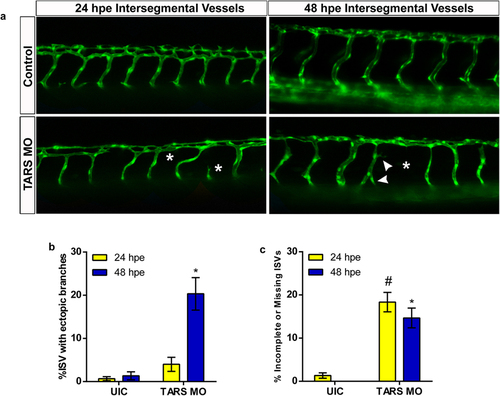
TARS is involved in vascular development in the zebrafish. (a) Representative confocal images (20× magnification) of control and TARS morphant zebrafish ISVs at 24 and 48 hpe. Embryos were injected with a TARS morpholino (1.5 µM) at the one to four cell stage. Fish were manually dechorionated at 24 h after fertilization and imaged at 24 and 48 hpe. Arrows and asterisks denote the location of ectopic branches and missing/incomplete vessels respectively. (b,c) Quantification of ectopic branching (b) and missing/incomplete ISVs (c) from control and morphant zebrafish within a region of encompassing five ISVs anterior and posterior to the yolk extension; mean ± SEM, n ≥ 29, #*p < 0.0001 relative to uninjected controls at 24 and 48 hpe respectively (one-way ANOVA, Tukey Test). See Supplementary Figure S10 for morpholino validation and morphological effects. |
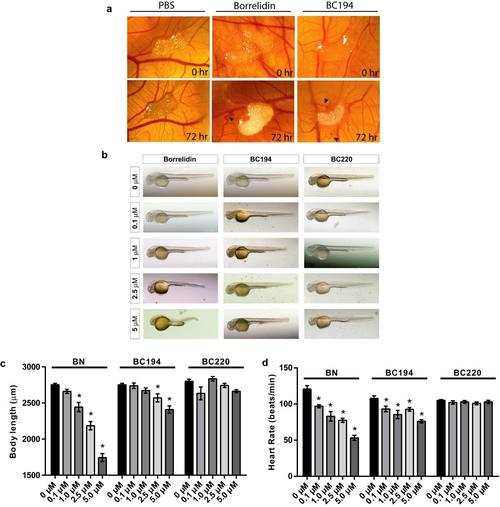
Exposure to BN and BC194 results in vascular defects and mis-patterning. (a) Representative CAM images showing rapid changes in vessel directionality, indicated by black arrows, before and after 72 hour treatment with PBS control, 1 µM BN, or 1 µM BC194. (b) Whole body images of 24 hpe zebrafish embryos treated with various concentrations of BN, BC194, and BC220 for 24 h. Extra DMSO was added to all samples, including 0 µM, as required to match the highest concentration used for each compound (0.025% for BN and BC194 and 0.1% in BC220). (c, d) Histograms showing the effects of BN, BC194, and BC220 exposure on zebrafish body length (c) and heart rate (d). Dechorionated embryos were incubated for 24 hours in egg water containing the indicated compounds. Body length measurements were obtained by analysis of bright-field images using Spot v 5.1 software; mean ± SEM, n=11, *p<0.05 relative to 0 nM (one-way ANOVA, Tukey Test). Heart rates were determined using bright-field microscopy to count heart beats over 15 second intervals; mean ± SEM, n=16, *p<0.05 relative to 0 nM (one-way ANOVA, Tukey Test).PHENOTYPE:
|
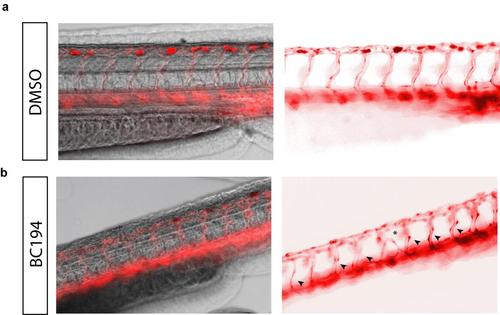
Treatment with BC194 inhibits blood-flow through zebrafish ISVs. (a, b) Still frame image from videos of trunk blood flow in zebrafish embryos 72 hours after fertilization (left) and fluorescence image of blood vessels (right) treated with DMSO (a) or 5 µM BC194 (b) for 48 h. Non-functioning lumens and ectopic branches are designated with black arrows and asterisks respectively. |
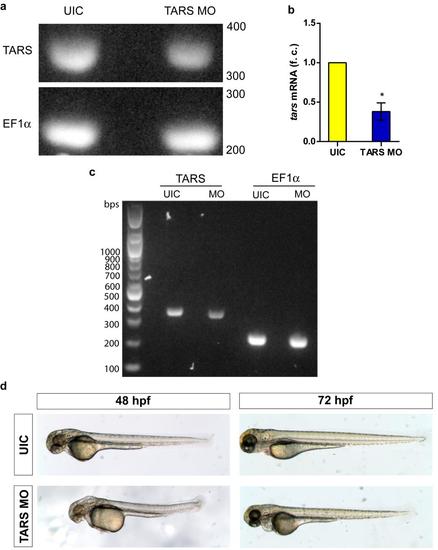
Depletion of TARS elicits a similar vascular phenotype to BN and BC194 inhibition. (a-b) RT-PCR (a) and RT-qPCR (b) of trizol/chloroform extracted mRNA from uninjected controls (UIC) and TARS morphants (MO) validate the reduction of TARS levels by morpholino injection. (a) Whole fish mRNA (48 hpe) was amplified by RT-PCR with gene specific primers. The TARS (338 bp) and EF1a control amplicons were run on 1.5% agarose to show differences in relative intensities between uninjected controls (UIC) and morphant fish. (b) cDNA was generated from isolated mRNA using oligo-dT primers and the tars expression relative to EF1α was determined by the ΔΔCT method; mean ± SEM, n=2, *p<0.05 relative to UIC (unpaired t-test). (c) Full size gel for image shown in a. (d) Whole body images of UIC and TARS morphant fish at 24 and 48 hpe. |