
Fig. S2
- ID
- ZDB-FIG-151008-23
- Publication
- Hu et al., 2015 - Loss of DDB1 Leads to Transcriptional p53 Pathway Activation in Proliferating Cells, Cell Cycle Deregulation, and Apoptosis in Zebrafish Embryos
- Other Figures
- All Figure Page
- Back to All Figure Page
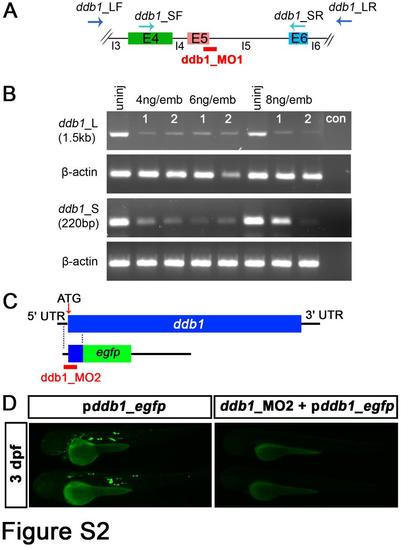
Evaluation of the knockdown efficiency of ddb1 morpholinos. (A-B) RT-PCR to test the efficiency of ddb1 splice site targeted morpholino (ddb1_MO1). (A) Schematic diagram of ddb1_MO1 targeting the 5th exon-intron junction. (B) Efficiency assay of ddb1_MO1 by RT-PCR using two pairs of ddb1-specific primers. The amount of RNA and cDNA used for RT-PCR was the same for the different samples and for the internal control β-actin. Negative control (con) contained no cDNA. (C-D) Evaluation of the knockdown efficiency of ddb1 translation start site morpholino (ddb1_MO2). (C) Schematic representation of ddb1-egfp fusion construct used for ddb1_MO2 efficiency assay. (D) The expression of EGFP in larvae injected with ddb1-egfp fusion construct together with or without ddb1_MO2. Anterior towards the left. Abbreviations used: E4/E5/E6, 4th /5th /6th exon; I4/I5/I6, 4th / 5th / 6th intron; ddb1_LF/R, the forward and reverse primers of longer ddb1-specific fragment; ddb1_SF/R, forward and reverse primers of shorter ddb1-specific fragment; 1 and 2, different samples; uninj, uninjected embryos. |