
Fig. 1
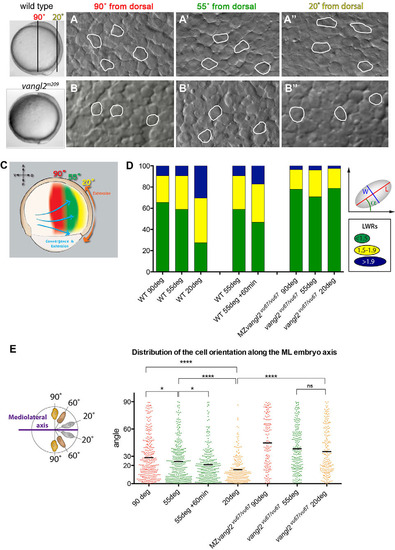
Spatiotemporal dynamics of mesodermal cells during C&E. (A-B′′) Nomarski images of mesodermal cells at 90° (A,B), 55° (A′,B′) and 20° (A′′,B′′) from dorsal in WT (A-A′′) and vangl2 mutant (vangl2m209/m209, B-B′′) embryos at yolk plug closure stage (9.5hpf). Selected cells are outlined to indicate shape. (C) Schematic representation of zebrafish embryo at 75% epiboly stage, showing the locations examined: 90° (red), 55° (green) and 20° (yellow). (D) The distribution of cell length to width ratio (LWR) at the examined locations and time points in WT, vangl2vu67/vu67 and MZvangl2vu67/vu67 embryos. The schematic explains the method used to measure the cell shape (LWR) and orientation (angle α). (E) Orientation of the major axis of each cell analyzed within the examined locations at 9hpf in WT, vangl2vu67/vu67 and MZvangl2vu67/vu67 embryos, and at 9hpf and 10hpf at the 55° location. *P<0.05, ****P<0.0001; ns, not significant; unpaired t-test with Welch′s correction; bar indicates the mean angle. |