
Fig. 3
- ID
- ZDB-FIG-150921-38
- Publication
- Anderson et al., 2015 - In vivo Modeling Implicates APOL1 in Nephropathy: Evidence for Dominant Negative Effects and Epistasis under Anemic Stress
- Other Figures
- All Figure Page
- Back to All Figure Page
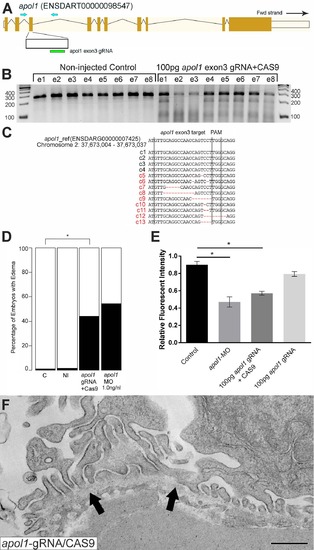
apol1-CRISPR F0 zebrafish embryos reproduce phenotypes observed in apol1 morphants. (A) Schematic of the zebrafish apol1 locus and location of the guide RNA (gRNA) target used for apol1-CRISPR experiments; the primers used to PCR-amplify the target region are shown (arrowheads). (B) At 1 dpf, a representative sampling of 8 founders and 8 non-injected controls were selected and subjected to T7 endonuclease 1 (T7E1) assay. The appearance of T7E1 fragments at ~180bp indicate positive gRNA targeting of exon 3 in the apol1 locus. No T7E1 fragments were detected in non-injected control embryos. In total, 25 out of 41 founders subjected to T7E1 assay showed the presence of T7E1 fragments, indicating that ~61% of founders have insertion/deletions (indels) in the exon 3 region of apol1. (C) Multiple sequence alignment of apol1 reference sequence (ENSDARG00000007425) to apol1-CRISPR variants generated from PCR amplification and subsequent TA cloning and sequencing of two representative apol1-gRNA/CAS9 injected founders. 13 PCR-cloned sequences are shown, representing four wild-type variants (c1-4) and all indel types detected among 50 PCR-clones (c5-13). Of 50 total PCR-clones sequenced, 31 showed detectable indels, representing an estimated 62% mosaicism in apol1-CRISPR/CAS9 injected founders. Lines mark the specific sequence targeted by the apol1-gRNA (exon3) and the location of the PAM recognition motif (i.e. TGG). (D) apol1-gRNA and CAS9 co-injected embryos were scored for edema formation at 5 dpf (n = 26–31 embryos/injection, repeated three times; *p<0.001). (E) apol1-gRNA and CAS9 co-injected embryos display increased glomerular clearance of 70kDa dextran-FITC compared to control embryos over time, similar to that of apol1-MO injected embryos (*p<0.001). Bar graphs summarize the changes for each injection group. Dextran values are in relative fluorescence intensity, mean ± SE. Control, sham-injected control (n = 19–21); apol1-gRNA+CAS9 (n = 11–17); apol1-gRNA alone (n = 13–14), repeated 2 times. (F) apol1-CRISPR/CAS9 injected embryos display podocyte foot process effacement at 5 dpf, similar to that of apol1 morphant larvae. Ultrastructural defects appear less severe when compared to apol1-MO injected embryos, however, including less foot process effacement and the absence of microvilli in the urinary space. Filled arrowheads, glomerular basement membrane. Scale bar, 500nm. |
| Fish: | |
|---|---|
| Knockdown Reagent: | |
| Observed In: | |
| Stage: | Day 5 |