
Fig. 2
- ID
- ZDB-FIG-150921-37
- Publication
- Anderson et al., 2015 - In vivo Modeling Implicates APOL1 in Nephropathy: Evidence for Dominant Negative Effects and Epistasis under Anemic Stress
- Other Figures
- All Figure Page
- Back to All Figure Page
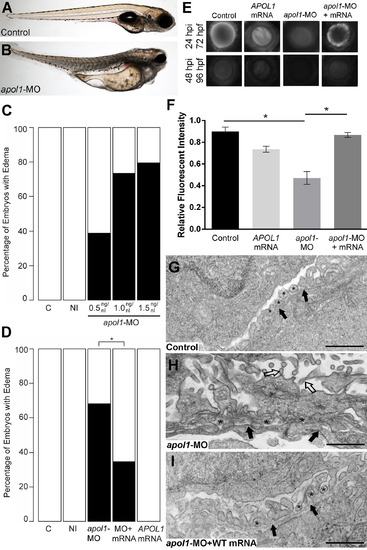
apol1 morphant zebrafish embryos display generalized edema and glomerular filtration defects indicative of nephropathy. Representative live images of (A) sham-injected control larvae, and (B) apol1 morpholino (MO) injected larvae at 5 dpf. apol1 morphants display pericardial and yolk sac edema. (C) Injection of increasing doses of apol1-MO demonstrate dose-dependent effects when scored for generalized edema (n = 35–65 embryos/injection; repeated three times) compared to control larvae at 5 dpf. apol1 morpholino injected embryos were complemented with the respective human mRNA to APOL1 (100pg/nl) and scored for generalized edema at 5 dpf. (D) Ectopic expression of APOL1 rescues significantly the edema phenotype observed in apol1 morphants (1.0 ng/nl dose). We observed no significant phenotypes when APOL1 human mRNA is injected alone. 70kDa dextran-FITC conjugate was injected into the cardiac venous sinus of 48 hpf zebrafish larvae and fluorescence intensity in the eye vasculature was measured at 24 and 48 hpi. (E) Representative eye image series of zebrafish larvae for each injection group show a relatively stable or a decrease in fluorescence intensity over time compared to sham-injected controls. (F) Bar graphs summarize the fluorescence changes observed for each injection group for apol1 morphant larvae. Reduction in fluorescence intensity over the pupil was calculated relative to the 24 hpi time point; apol1 morphants display increased glomerular clearance of 70kDa dextran-FITC compared to control embryos over time, indicative of compromised glomerular filtration and proteinuria. These defects were rescued significantly when MO was co-injected with orthologous human mRNA. (G-I) Compared to (G) sham-injected controls, the glomerular ultrastructure of (H) apol1 morphant zebrafish display partial effacement of podocyte foot process (* asterisks), although the glomerular basement membrane (filled arrowheads) appears normal. Microvillus protrusions (open arrowheads) are also apparent in the urinary space. (I) Ultrastructure defects are rescued upon co-injection of human wild-type mRNA (100pg). Scale bar, 500nm. White bars, normal; black bars, edema. MO concentrations are in µg/µl, with 1nl injected into each embryo. C, sham-injected control; NI, non-injected control. Dextran values are in relative fluorescent intensity, mean ± SE. Control, sham-injected control (n = 29); MO, apol1 morpholino injected (n = 26); apol1-MO+mRNA (n = 28). h.p.f., hours post-fertilization; h.p.i., hours post-injection. *p<0.001. |
| Fish: | |
|---|---|
| Knockdown Reagent: | |
| Observed In: | |
| Stage: | Day 5 |