
Fig. 2
- ID
- ZDB-FIG-150514-13
- Publication
- Wang et al., 2014 - Expression analysis of integrin β1 isoforms during zebrafish embryonic development
- Other Figures
- All Figure Page
- Back to All Figure Page
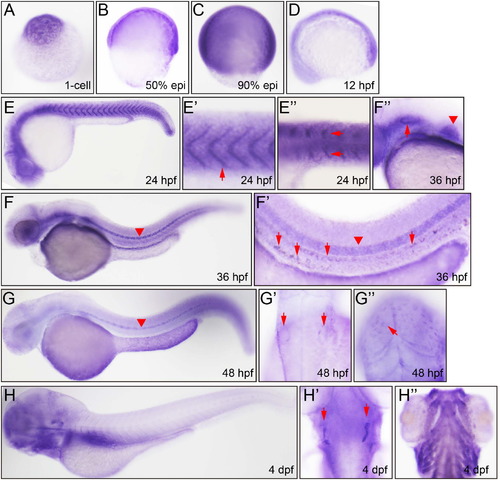
Whole mount in situ hybridization analysis of zebrafish embryos using antisense itgb1b probe. A. 1-cell, lateral view, strong staining. B. 50% epiboly, lateral view. C. 80% epiboly, lateral view. D. 12 hpf, lateral view, epidermis. E. 24 hpf, lateral view. E′. 24 hpf, lateral view, myotome borders (arrow). E′. 24 hpf, dorsal view, myotome borders (arrow) F. 36 hpf, lateral view, notochord (arrowhead). F′. 36 hpf, lateral view, notochord (arrowhead), trunk vessel (arrow). G. 48 hpf, lateral view, notochord (arrowhead). G′. 48 hpf, dorsal view, otic vesicle (arrow). G″. 48 hpf, dorsal view, head epidermis, enveloping layer (EVL). H. 4 dpf, lateral view. H′. 4 dpf, dorsal view, otic vesicle (arrow). H″. 4 dpf, ventral view, branchial arch. |
| Gene: | |
|---|---|
| Fish: | |
| Condition: | |
| Anatomical Terms: | |
| Stage Range: | 1-cell to Day 4 |
Reprinted from Gene expression patterns : GEP, 16(2), Wang, X., Li, L., Liu, D., Expression analysis of integrin β1 isoforms during zebrafish embryonic development, 86-92, Copyright (2014) with permission from Elsevier. Full text @ Gene Expr. Patterns