
Fig. 6
- ID
- ZDB-FIG-150423-37
- Publication
- Filipek-Górniok et al., 2015 - The Ndst Gene Family in Zebrafish: Role of Ndst1b in Pharyngeal Arch Formation
- Other Figures
- All Figure Page
- Back to All Figure Page
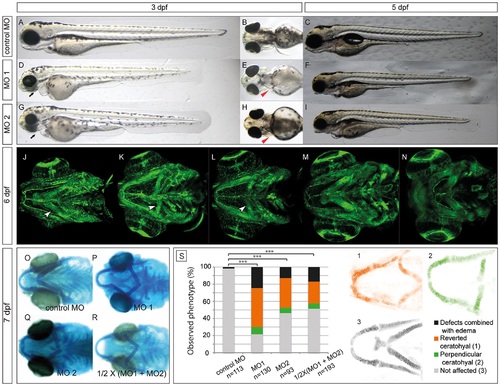
Morpholino knockdown of zebrafish ndst1b results in craniofacial cartilage defects at the early stages of development (3–7 dpf). Lateral and ventral view of a zebrafish larvae at 3 dpf injected with either control MO mix (A-B), MO1 (D-E) or MO2 (G-H) in combination with p53 MO (see Experimental Procedures). The black arrows point at the underdeveloped craniofacial cartilage of ndst1b morphants, while the red arrow heads point at the pectoral fins of the morphants, shortened in comparison to fins of the control larvae. At 5 dpf, the effects of the ndst1b MOs on zebrafish larvae were still visible. ndst1b MO treated larvae had shortened pectoral fins and body axis, smaller head and eyes, underdeveloped craniofacial cartilage and no swimming bladder (C,F,I). Confocal microscope images present a ventral view of Tg(fli1:EGFP) zebrafish larvae. GFP is expressed in endothelial and neural crest derived cells. Morphants displayed severe malformations in the pharyngeal cartilage structures (K, L) in comparison to control larvae (J). In contrast, chondrocyte stacking and flattening does not appear to be strongly affected, as compared to extl3-/- and ext2-/- mutant embryos (M-N) with clear chondrocyte stacking defects. The second pharyngeal arch (the ceratohyal), incorrectly localized in the ndst1b morphants, is indicated with a white arrow head (J-L). The incorrect localization is also seen after alcian blue staining of 7 dpf larvae injected with MO1, MO2 and half working dosage of these two combined (1/2 X (MO1 + MO2); O-R). Panel S of the figure represents quantification in percentage of the ceratohyal phenotype at day 6 of the development in phenotypic classes observed (chi-square test: *** p<0.001 comparing affected and nonaffected embryos). Confocal microscope images of the Tg(1.7col2a1a:mEGFP) fish (1–3) show the difference between reverted (1), perpendicular (2) and non-affected ceratohyals. |
| Fish: | |
|---|---|
| Knockdown Reagents: | |
| Observed In: | |
| Stage Range: | Protruding-mouth to Days 7-13 |