
Fig. 1
- ID
- ZDB-FIG-150330-20
- Publication
- Miller et al., 2015 - Neurobeachin Is Required Postsynaptically for Electrical and Chemical Synapse Formation
- Other Figures
- All Figure Page
- Back to All Figure Page
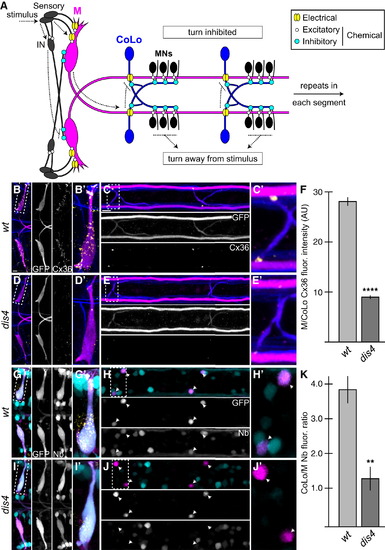
Electrical Synapses Are Disrupted in dis4 Mutants (A) Model of the Mauthner (M) circuit. Neurons, synapses, and behavioral output are depicted. Hindbrain and two spinal segments are shown. Dotted arrows depict flow of circuit activity given the indicated stimulus. (B–E and G–J) In this and all subsequent figures, except where noted, images are dorsal views of hindbrain and two spinal cord segments from M/CoLo:GFP larvae at 5 days postfertilization (dpf). The (′) panels are zooms of the regions denoted by the dotted boxes. Hindbrain and spinal cord images are maximum-intensity projections of <30 and <10 µm, respectively. Anterior is to the left. Scale bar represents 10 µm. Larvae are stained for GFP (magenta) and Connexin36 (Cx36, yellow) in all panels, neurofilaments (RMO44, blue) in (B)–(E), and Neurobiotin (Nb, cyan) in (G)–(J). Individual GFP, Cx36, and Nb channels are shown in neighboring panels. (B–E) The Cx36 staining found at M dendrites (B and B′) and M/CoLo synapses (C and C′) is reduced in dis4 mutant animals (D and E). (F) Quantitation of Cx36 at M/CoLo synapses in wild-type and dis4 mutants. (G–J) Electrical synapses are functionally defective in dis4 mutants. Images show experiments in which M axons were filled with the gap-junction-permeable dye Nb from a caudal transection in the spinal cord. Spinal cord images are at the level of the CoLo cell bodies (arrowheads), which are dorsal to the synapses. (G and H) Nb labels the M cell bodies and other caudally projecting neurons (G and G′) and passes through the Cx36 gap junctions to fill the CoLo cell bodies (H and H′, arrowheads). Other neurons are also labeled due to projections caudally into the lesion site. (I and J) In dis4 mutants, Nb labels M normally (I and I′); however, the amount passing into CoLos is diminished (J and J′, arrowheads). (K) Quantitation of ratio of Nb in CoLo to M cell bodies in wild-type and dis4 mutants. Graphs in (F) and (K) represent data as mean ± SEM. p < 0.01 and p < 0.0001 compared to control. Associated experimental statistics are found in Table S2. |
| Gene: | |
|---|---|
| Antibody: | |
| Fish: | |
| Anatomical Terms: | |
| Stage: | Day 5 |
| Fish: | |
|---|---|
| Observed In: | |
| Stage: | Day 5 |