
Fig. 6
- ID
- ZDB-FIG-150309-20
- Publication
- Gabor et al., 2014 - Influenza a virus infection in zebrafish recapitulates mammalian infection and sensitivity to anti-influenza drug treatment
- Other Figures
- All Figure Page
- Back to All Figure Page
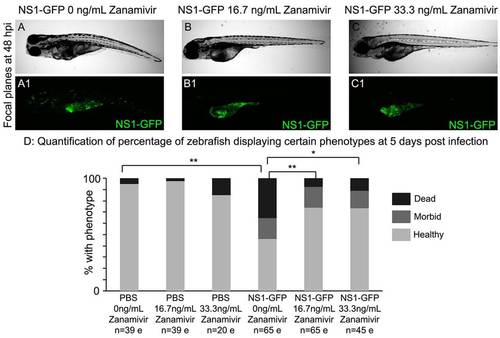
Antiviral treatment with Zanamivir confers protection after infection in zebrafish. Zanamivir (16.7 ng/ml or 33.3 ng/ml) was administered at 3 hpi, and Zanamivir-containing media was changed twice daily. (A–C1) Single focal planes of NS1-GFP-injected, live zebrafish at 48 hpi, side mounted, anterior left, dorsal top, ×4 magnification. Lettered panels are brightfield images, and numbered panels are fluorescence micrographs. (A,A1) NS1-GFP-infected zebrafish. Note fluorescence in the yolk region, as well as punctate fluorescence throughout the body. (B,B1) NS1-GFP-infected zebrafish treated with 16.7 ng/ml Zanamivir. (C,C1) NS1-GFP-infected zebrafish treated with 33.3 ng/ml Zanamivir. Note that treatment with Zanamivir at either dose drastically reduced the punctate fluorescence in the body of the zebrafish, whereas fluorescence in the yolk region remained despite antiviral treatment. The data presented represent three individual experiments, a mean of n=20 fish per treatment. (D) Quantification of healthy, morbid and dead zebrafish at 5 days post infection with NS1-GFP. These data are compiled from three independent experiments, and the number of zebrafish per treatment group is labeled on the graph. e, embryos. Fisher’s exact test two-tailed P-values (with Bonferroni correction) were used to determine whether the proportion of dead versus alive (healthy and morbid) zebrafish significantly differed between treatments. Addition of either dose of Zanamivir to PBS-injected controls did not significantly affect the proportion of zebrafish that died. Infection with NS1-GFP significantly increased the proportion of dead zebrafish compared with the PBS-injected group (P=0.0018). Addition of either dose of Zanamivir significantly decreased the proportion of NS1-GFP-infected zebrafish that died compared with the infected, untreated group (P=0.0012 and P=0.0246 for 16.7 ng/ml and 33.3 ng/ml Zanamivir, respectively). *P<0.05, **P<0.01. |