
FIGURE
Fig. 3
- ID
- ZDB-FIG-150302-15
- Publication
- Nakayama et al., 2014 - Identification and expression analysis of zebrafish polypeptide α-N-acetylgalactosaminyltransferase Y-subfamily genes during embryonic development
- Other Figures
- All Figure Page
- Back to All Figure Page
Fig. 3
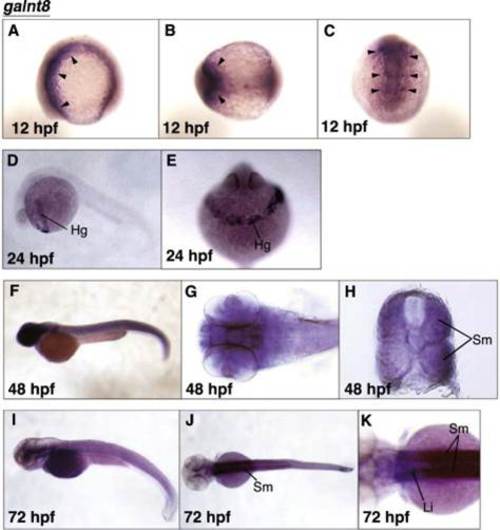
Spatial expression patterns of galnt8 during developmental stages. Whole mount in situ hybridization of galnt8 was performed at the developmental stages indicated at the bottom left corners. Lateral views with anterior to the left and dorsal to the top (A, D, F, and I). Dorsal views with anterior to the left (B, G, J, and K). A dorsal view of the head region (C). Anterior view of the hatching gland (E). A transverse section view of the trunk musculature (H). Arrowheads in A-C indicate the cephalic mesoderm. Hg; hatching gland, Sm; somitic musculature, Li; liver. |
Expression Data
| Gene: | |
|---|---|
| Fish: | |
| Anatomical Terms: | |
| Stage Range: | 5-9 somites to Protruding-mouth |
Expression Detail
Antibody Labeling
Phenotype Data
Phenotype Detail
Acknowledgments
This image is the copyrighted work of the attributed author or publisher, and
ZFIN has permission only to display this image to its users.
Additional permissions should be obtained from the applicable author or publisher of the image.
Reprinted from Gene expression patterns : GEP, 16(1), Nakayama, Y., Nakamura, N., Kawai, T., Kaneda, E., Takahashi, Y., Miyake, A., Itoh, N., Kurosaka, A., Identification and expression analysis of zebrafish polypeptide α-N-acetylgalactosaminyltransferase Y-subfamily genes during embryonic development, 1-7, Copyright (2014) with permission from Elsevier. Full text @ Gene Expr. Patterns