
FIGURE
Fig. 2
- ID
- ZDB-FIG-150302-14
- Publication
- Nakayama et al., 2014 - Identification and expression analysis of zebrafish polypeptide α-N-acetylgalactosaminyltransferase Y-subfamily genes during embryonic development
- Other Figures
- All Figure Page
- Back to All Figure Page
Fig. 2
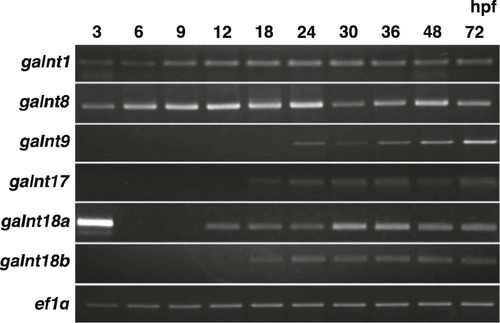
Temporal expression patterns of Y-subfamily galnt genes during zebrafish embryonic development. Zebrafish galnt cDNAs were amplified by RT-PCR at the indicated developmental stages. Cropped images of the gels are shown. The lowest panel shows results for zebrafish elongation factor 1-alpha (ef1a) as a control. These experiments were repeated three times and the data from a representative experiment are shown. |
Expression Data
| Genes: | |
|---|---|
| Fish: | |
| Anatomical Term: | |
| Stage Range: | 1k-cell to Protruding-mouth |
Expression Detail
Antibody Labeling
Phenotype Data
Phenotype Detail
Acknowledgments
This image is the copyrighted work of the attributed author or publisher, and
ZFIN has permission only to display this image to its users.
Additional permissions should be obtained from the applicable author or publisher of the image.
Reprinted from Gene expression patterns : GEP, 16(1), Nakayama, Y., Nakamura, N., Kawai, T., Kaneda, E., Takahashi, Y., Miyake, A., Itoh, N., Kurosaka, A., Identification and expression analysis of zebrafish polypeptide α-N-acetylgalactosaminyltransferase Y-subfamily genes during embryonic development, 1-7, Copyright (2014) with permission from Elsevier. Full text @ Gene Expr. Patterns