
Fig. 2
- ID
- ZDB-FIG-141017-3
- Publication
- Hofmeister et al., 2013 - Distinct expression patterns of syndecans in the embryonic zebrafish brain
- Other Figures
- All Figure Page
- Back to All Figure Page
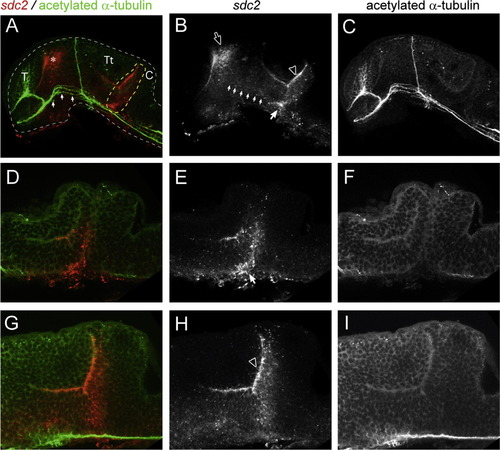
sdc2 expression in zebrafish neuroepithelium. Confocal sections of the zebrafish brain at 28 hpf, showing expression of sdc2 (B, E, H and in red A, D, G) in relation to the axon scaffold (C, F, I and in green A, D, G). Compiled z-sections are shown in A-C while 2.0 µm sections are represented in D-I. Panels-D-F represent higher magnificantions of A-C at the level of the isthmus with D-F being medial optical slices and G-I more lateral sections. In all panels rostral is to the left and dorsal to the top. Strong expression is particularly seen at the rostraldorsal diencephalon adjacent to the dorsal most point of the forebrain ventricle (asterix in A, unfilled arrow in B) and adjacent to the midbrain ventricle (unfilled arrowhead in B and H), expression in this region extends into the isthmus (dashed yellow outline in A, unfilled arrow in B and H). Weak expression between the diencephalon and tegmentum is also indicated (small filled arrows in B). The telencephalon (T), tectum (Tt) and cerebellum (C) all remain absent for sdc2 expression. Scale bar in C and I is 100 µm. |
| Gene: | |
|---|---|
| Fish: | |
| Anatomical Terms: | |
| Stage: | Prim-5 |
Reprinted from Gene expression patterns : GEP, 13(3-4), Hofmeister, W., Devine, C.A., and Key, B., Distinct expression patterns of syndecans in the embryonic zebrafish brain, 126-32, Copyright (2013) with permission from Elsevier. Full text @ Gene Expr. Patterns