
Fig. 2
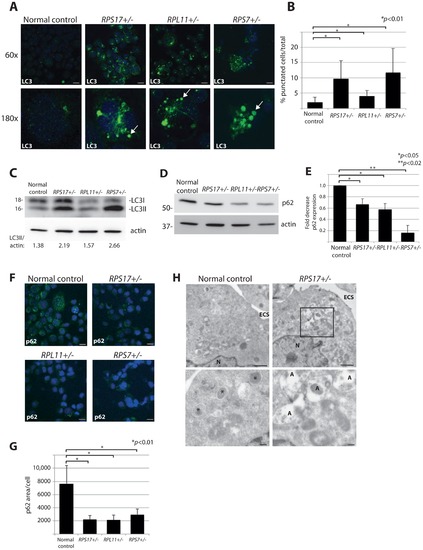
DBA mutations induce autophagy. (A) Immunofluorescence with LC3 antibodies in LCLs derived from a normal control or DBA patients. Higher magnifications are represented in the lower panel. Arrows denote puncta indicative of LC3 recruitment to autophagosomes, or accumulation in autolysosomes. Size bars = 10 μM. (B) Quantification of the percent of cells revealing LC3 puncta compared to the total number of cells in the 60x shots. (C) Western blot analysis of LC3 in DBA LCLs compared to normal controls. The LC3II/actin ratio is determined by densitometer analysis. (D) Representative western blot analysis of p62 levels in normal control and DBA patient LCLs. (E) Densitometer analysis of p62 protein expression from western blots (N = 3) represented in (D). (F) Immunofluorescence with p62 antibodies of LCLs derived from a normal control or DBA patients. Size bars = 10 μM. (G) ImageJ measurements of p62 expression in (F) per total cell area. (H) Representative electron micrographs of LCLs derived from a normal control and RPS17 cells. Control cells have small typically dense lysosomes (*). The much larger autolysosomes (A) are only detected in RPS17 LCLs. The boxed area in the upper right panel is shown at higher magnification in the lower right panel. N = nucleus, ECS = extracellular space. Bars in top panels = 1 μM, bottom panels = 200 nM. |