
Fig. 3
- ID
- ZDB-FIG-140818-18
- Publication
- Zhong et al., 2014 - RETRACTED: Zebrafish Noxa promotes mitosis in early embryonic development and regulates apoptosis in subsequent embryogenesis
- Other Figures
- All Figure Page
- Back to All Figure Page
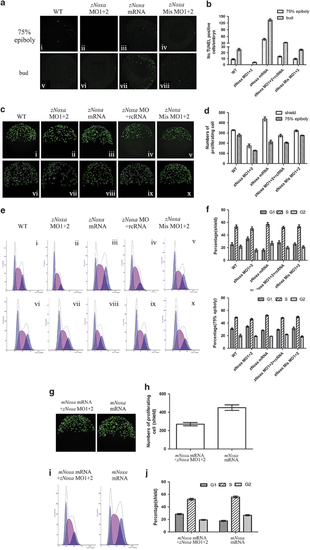
zNoxa controls mitosis and apoptosis during early embryogenesis. (a) Confocal z-stacks of apoptotic cells assessed by TUNEL in embryos which were WT (i, v) and injected with zNoxa MO1+2 (ii, vi), zNoxa mRNA (iii, vii) or zNoxa mismatch MO1+2 (iv, viii) at 75% epiboly and bud stages. Embryos were lateral views with animal pole toward the top and dorsal to the right. (b) Quantification of numbers of TUNEL-positive cells with approximately four embryos for each group in a. Error bars represent S.E.M. (n=4). (c) Confocal z-stacks of mitotic cells assessed by pH3 (phosphorylated histone H3) staining in embryos which were WT (i, vi) and injected with zNoxa MO1+2 (ii, vii), zNoxa mRNA (iii, viii), combined zNoxa MO1+2 and rcRNA (iv, ix) or zNoxa mismatch MO1+2 (v, x) at shield and 75% epiboly stages. Embryos stained by pH3 were lateral views with animal pole toward the top and dorsal to the right. (d) Quantification of numbers of pH3-positive cells with five embryos for each group in c. Error bars represent S.E.M. (n=5 embryos each). (e) A typical FACS analysis of PI (propidium iodide)-labeled cells in embryos for each group in c. (f) The FACS statistical data of three independent experiments in e. Error bars represent S.E.M. (n=3). (g) Confocal z-stacks of mitotic cells assessed by pH3 staining in embryos which were injected with zNoxa MO1+2 plus mNoxa mRNA or mNoxa mRNA at shield stage. (h) Quantification of numbers of pH3-positive cells with five embryos for each group in g. Error bars represent S.E.M. (n=5 embryos each). (i) A typical FACS analysis of PI-labeled cells in embryos for each group in g. (j) The FACS statistical data of three independent experiments in i. Error bars represent S.E.M. (n=3) |