
Fig. 1
- ID
- ZDB-FIG-140807-61
- Publication
- Miyares et al., 2014 - Zebrafish yolk lipid processing: a tractable tool for the study of vertebrate lipid transport and metabolism
- Other Figures
- All Figure Page
- Back to All Figure Page
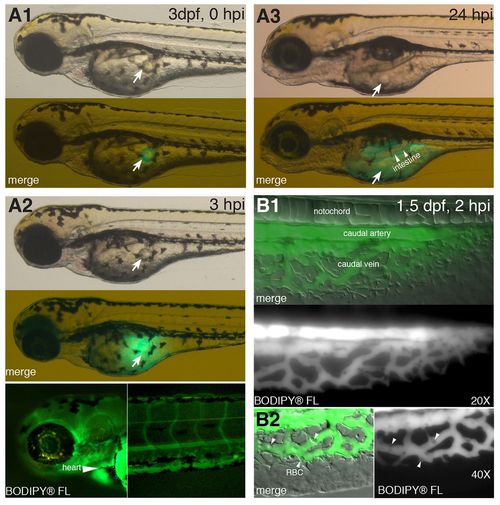
Rapid absorption following yolk delivery of labeled fatty acid. BODIPY-labeled fatty acid (BODIPY® FL C12), dissolved in canola oil (0.5–1.5 ng/nl), was injected into the yolk of zebrafish larvae. (A1–A3) Timecourse of fatty acid absorption. BODIPY® FL C12 (0.5 ng/nl) was injected into larvae at 3 dpf. The images shown are representative (n=4) and are taken from the same larva at different timepoints after injection (indicated in the top right-hand corner). Brightfield images in the top panels show the location of the canola oil drop (white arrow). The second panel shows combined brightfield and BODIPY® FL C12 fluorescence (green) images. (A1) At 5–10 minutes post-injection. (A2) At 3 hpi. Bottom panels reveal BODIPY-labeled fatty acid in the heart (arrowhead) and head vessels (left) and tail vasculature (right). (A3) At 24 hpi. Bottom panel reveals BODIPY® FL C12 in the yolk and newly formed intestinal lumen (arrowheads). (B) Labeled fatty acid enters the circulation. BODIPY® FL C12 (1.5 ng/nl) was injected into 1.5-dpf larvae and analyzed 2 hours later. BODIPY-labeled fatty acid fluorescence is shown merged with Nomarski microscopy to reveal larval anatomy. Images shown are representative (n=4). BODIPY-labeled fatty acids were distributed in the caudal artery and the caudal vein. (B1) ×20 magnification. (B2) ×40 magnification. Arrowheads point to red blood cells (RBC). |