
Fig. 2
- ID
- ZDB-FIG-140807-24
- Publication
- Jay et al., 2014 - Effects of nitric oxide on neuromuscular properties of developing zebrafish embryos
- Other Figures
- All Figure Page
- Back to All Figure Page
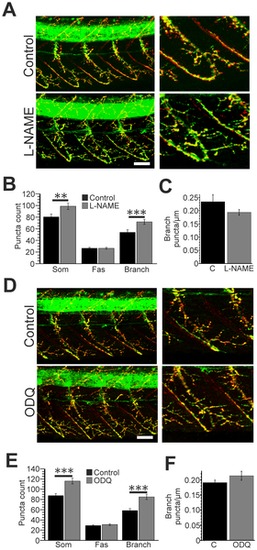
A. Left hand panels: lateral trunk views of control (top) and L-NAME (bottom) treated zebrafish at 2 days post fertilisation (dpf) processed with anti-SV2 (green) and Rh-α-BTX (red) staining. Right hand panels: expanded regions showing staining localised to a single somitic region. B. Bar chart depicting the mean (± SEM) number of synapses located within each somite (som), along motor fascicles (fas) and along branch-associated domains (branch) of control (black) and L-NAME (grey) treated fish. C. Mean density of branch-associated puncta in control (black) and L-NAME treated (grey) fish. D. Left hand panels: lateral trunk views of control (top) and ODQ (bottom) treated zebrafish at 2 dpf. Right hand panels: expanded regions showing staining localised to a single somitic region. E. Bar chart depicting the mean (± SEM) number of synapses located within each somite (som), along motor fascicles (fas) and along branch-associated domains (branch) of control (black) and ODQ (grey) treated fish. F. Mean density of branch-associated puncta in control (black) and ODQ treated (grey) fish. Scale bars = 30 µm. **pd0.01, ***pd0.001. |