
- Title
-
Effects of nitric oxide on neuromuscular properties of developing zebrafish embryos
- Authors
- Jay, M., Bradley, S., and McDearmid, J.R.
- Source
- Full text @ PLoS One
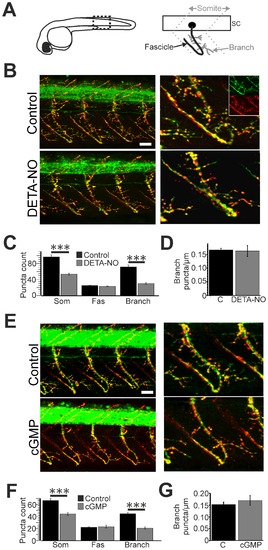
A. Left: schematic illustration of a zebrafish embryo at 2 days post fertilisation (dpf). Dashed box indicates region used for puncta analysis. Right: schematic illustration of a motoneuron at 2 dpf. Motoneuron somata (black circle) are located within the spinal cord (sc) and their axons extend along fascicles (solid black line) into the somitic region. Axon branches (solid grey lines) extend from the main fascicle. Dashed lines indicate somitic boundaries B. Left hand panels: lateral trunk views of anti-SV2 (green)/Rh-α-BTX (red) co-staining in control (top) and DETA-NO treated (bottom) zebrafish at 2 dpf. Right hand panels: expanded regions showing staining localised to a single somitic region. Insets show SV2 (upper) and Rh-α-BTX (lower) z-projections from which merged images were derived. C. Bar chart depicting the mean (α SEM) number of synapses located within each somite (som), along motor fascicles (fas) and along branch-associated regions (branch) of control (black) and DETA-NO (grey) treated fish. D. Mean density of branch-associated puncta in control (black) and DETA-NO treated (grey) fish. E. Left hand panels: lateral trunk views of anti-SV2 (green)/Rh-α-BTX (red) co-staining in control (top) and 8-pCPT-cGMP treated (cGMP, bottom) zebrafish at 2 dpf. Right hand panels: expanded regions showing staining localised to a single somitic region. F. Bar chart depicting the mean (α SEM) number of synapses located within each somite (som), along motor fascicles (fas) and along branches of control (black) and 8-pCPT-cGMP (cGMP, grey) treated fish. G. Mean density of branch-associated puncta in control (black) and 8-pCPT-cGMP treated (cGMP, grey) fish. Scale bars = 30 µm. ***pd0.001. |
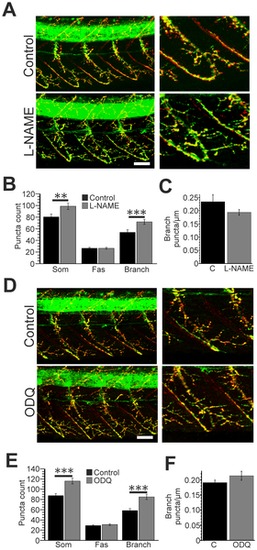
A. Left hand panels: lateral trunk views of control (top) and L-NAME (bottom) treated zebrafish at 2 days post fertilisation (dpf) processed with anti-SV2 (green) and Rh-α-BTX (red) staining. Right hand panels: expanded regions showing staining localised to a single somitic region. B. Bar chart depicting the mean (± SEM) number of synapses located within each somite (som), along motor fascicles (fas) and along branch-associated domains (branch) of control (black) and L-NAME (grey) treated fish. C. Mean density of branch-associated puncta in control (black) and L-NAME treated (grey) fish. D. Left hand panels: lateral trunk views of control (top) and ODQ (bottom) treated zebrafish at 2 dpf. Right hand panels: expanded regions showing staining localised to a single somitic region. E. Bar chart depicting the mean (± SEM) number of synapses located within each somite (som), along motor fascicles (fas) and along branch-associated domains (branch) of control (black) and ODQ (grey) treated fish. F. Mean density of branch-associated puncta in control (black) and ODQ treated (grey) fish. Scale bars = 30 µm. **pd0.01, ***pd0.001. |