
Fig. 4
- ID
- ZDB-FIG-140807-20
- Publication
- Zhang et al., 2014 - Heme acts through the Bach1b/Nrf2a-MafK pathway to regulate exocrine peptidase precursor genes in porphyric zebrafish
- Other Figures
- All Figure Page
- Back to All Figure Page
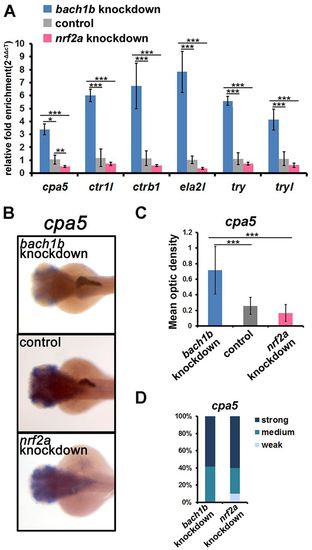
Knockdown experiments with bach1b and nrf2a reveal their antagonism in the regulation of zymogen expression. (A) qRT-PCR analysis showed that bach1b knockdown results in the upregulation of the six peptidase precursor genes that we examined, whereas nrf2a knockdown resulted in their downregulation. Knockdown experiments were performed by microinjecting MOs that targeted bach1b or nrf2a into one-cell stage embryos. For bach1b knockdown experiments, an ATG MO and SPL MO were used. Reverse transcription PCR showed that the SPL MO effectively altered bach1b intron 2 splicing (supplementary material Fig. S1A,B). The ATG MO also effectively knocked down bach1b (supplementary material Fig. S1C). The results using the SPL MO are shown here. For nrf2a knockdown experiments, we used an ATG MO, of which the efficacy of knockdown has been confirmed previously (Kobayashi et al., 2002; Kobayashi et al., 2009; Wang and Gallagher, 2013). The expression levels of the six peptidase precursor genes in the microinjected and control larvae at 84 hpf were determined by using qRT-PCR. (B) Representative images of in situ hybridization staining show that the upregulation of cpa5 resulted from bach1b knockdown and that its downregulation resulted from nrf2a knockdown, both results occurred specifically in the exocrine pancreas. Dorsal view, anterior to the left. (C) Mean optic densities of in situ hybridization staining of a group of larvae (10–12 each) corresponding to Fig. 4C were quantified by using ImageJ. (D) cpa5 morphant phenotypes. For individual larvae (84 hpf) of the bach1b knockdown overexpression group, the optic density values higher than the mean optic density value of its own group were marked as ‘strong’, and the optic density values lower than the mean optic density of the control group were marked as ‘weak’. For individual larvae of the nrf2a knockdown group, the optic density values lower than the mean optic density value of its own group were marked as ‘strong’, the optic density values higher than the mean optic density of the control group were marked as ‘weak’, and the values of optic density between ‘weak’ and ‘strong’ were marked as ‘medium’. The statistical significance of difference between means was determined by using one-way ANOVA and Tukey’s multiple comparison test (n=9) with SPSS10.0.1. *P<0.05, **P<0.01, ***P<0.001. |
| Gene: | |
|---|---|
| Fish: | |
| Knockdown Reagents: | |
| Anatomical Term: | |
| Stage: | Protruding-mouth |