
Fig. 3
- ID
- ZDB-FIG-140624-29
- Publication
- Zeng et al., 2014 - Cadm4 Restricts the Production of Cardiac Outflow Tract Progenitor Cells
- Other Figures
- All Figure Page
- Back to All Figure Page
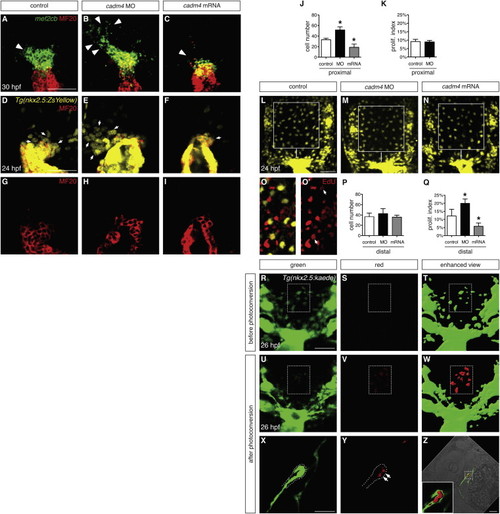
Cadm4 Limits Formation of OFT Progenitor Cells (A–C) In situ hybridization shows expression of mef2cb (green) in progenitor cells adjacent to the differentiated myocardium (MF20, red); partial reconstructions of dorsal views at 30 hpf, arterial pole up. In comparison with control embryos (A), this progenitor population (arrowheads) is expanded in cadm4 morphants (B) and reduced in embryos overexpressing cadm4 (C). (D–I) Partial reconstructions of dorsal views of arterial poles expressing Tg(nkx2.5:ZsYellow) (yellow, D–F) at 24 hpf; MF20 (red, D–I) marks differentiated CMs. In control embryos (D and G), undifferentiated progenitor cells (yellow, not red; arrows indicate examples) cluster in a proximal region adjacent to the arterial pole. This population is expanded in cadm4 morphants (E) and reduced in embryos overexpressing cadm4 (F). (J) Number of ZsYellow+MF20 OFT progenitor cells in the proximal region at 24 hpf in control embryos, cadm4 morphants, and embryos injected with cadm4 mRNA; asterisks indicate statistically significant differences from controls (p < 0.0001; n = 9–14). Comparable progenitor surpluses resulted from injection of either of two nonoverlapping MOs (52 ± 6 cells, ATG MO1 [n = 14]; 58 ± 6 cells, splice MO [n = 7]). (K) Proliferation indexes are comparable for the proximal OFT progenitor cells in control embryos and cadm4 morphants. (L–N) Partial reconstructions of dorsal views of the region near the arterial pole in embryos expressing Tg(nkx2.5:ZsYellow) at 24 hpf; images were captured with a higher gain than in (D)–(F). Squares indicate the region defined as distal in representative control (L), cadm4 morphant (M), and cadm4-overexpressing (N) embryos. (O and O’) EdU incorporation (red) in an embryo expressing Tg(nkx2.5:ZsYellow) (yellow); EdU is visible in at least two Tg(nkx2.5:ZsYellow)-expressing cells (arrows) in this representative slice. (P) The numbers of Tg(nkx2.5:ZsYellow)-expressing cells in the distal regions of control, cadm4 morphant, and cadm4-overexpressing embryos are similar (n = 7–12). (Q) The proliferation index is increased in the distal Tg(nkx2.5:ZsYellow)-expressing cells in cadm4 morphants (p < 0.0005) and is decreased in the same population in cadm4-overexpressing embryos (p < 0.0001). (R–W) Single slices show dorsal views near the arterial pole in a representative Tg(nkx2.5:kaede) embryo at 26 hpf, before (R–T) and after (U–W) photoconversion of a portion of the distal region (rectangle) containing approximately ten Tg(nkx2.5:kaede)-expressing cells (green in T, red in W). Enhanced views (T and W) were generated using the “surface” function in Imaris to highlight cells expressing low levels of Tg(nkx2.5:kaede). (X–Z) Single slices show lateral views of Tg(nkx2.5:kaede) expression in the heart at 30 hpf and indicate that three or four of the photoconverted cells (red, arrows) have become OFT CMs. Dots (X and Y) outline the ventral wall of the forming OFT. Bright-field image and magnified inset (Z) show the incorporation of red photoconverted cells within the green OFT myocardium. Similar results were obtained in four independent embryos. Bar graphs display mean and SD for each data set. Scale bars, 50 μm. See also Figures S2 and S3. |
| Genes: | |
|---|---|
| Antibody: | |
| Fish: | |
| Knockdown Reagent: | |
| Anatomical Terms: | |
| Stage Range: | Prim-5 to Prim-15 |