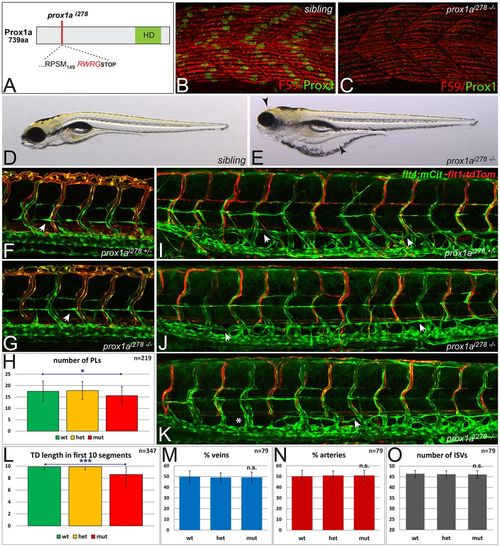
Lymphangiogenesis in prox1a mutant embryos. (A) Schematic of the homeodomain (HD) containing Prox1a protein, indicating the predicted effect of the 10 bp deletion in the prox1ai278 allele, leading to a frame-shift (red amino acids) and a truncated protein after 153 amino acids. (B,C) Prox1a immunostaining of slow muscle fibers in sibling (B) and homozygous mutant prox1ai278 (C) embryos demonstrates a complete loss of wild-type Prox1a protein (green) at 30 hpf (slow myosin heavy chain-1 is shown in red). (D,E) Brightfield pictures of 5 dpf sibling (D) and homozygous prox1ai278 mutant (E) embryos. Note the strong edema formation around the eye and gut area (arrowheads), which can be even more pronounced in other prox1a mutants at this stage. (F,G) In both heterozygous siblings (F) and homozygous prox1ai278 mutants (G), PLs appear at the level of the horizontal myoseptum at 2 dpf (arrows). (H) Average PL numbers per embryo are mildly reduced in prox1a mutants at 2 dpf (Student’s t-test, *P=0.025). Error bars indicate s.d. of wild-type (green), heterozygous (orange) and mutant (red) groups in embryos from a prox1a+/- incross. (I-K) flt4:mCit; flt1enh:tdTom double transgenic embryos highlighting arterial ISVs in red and venous and lymphatic structures in green. Compared with heterozygous siblings (I), most homozygous prox1ai278 mutants do not display TD defects at 5 dpf (J), whereas others display a mild reduction (K) in some areas of the trunk (arrows point at TD; asterisks mark the lack of TD). Note the overall unaffected ratio of venous and arterial ISVs in mutants (J,K). (L) Average number of segments positive for TD cells, scored in the first ten segments above the yolk extension at 5 dpf. Error bars indicate the s.d. for the respective genotypic class from a prox1a+/- incross. ***P=2.3E-08 (Student’s t-test, comparison of wild-type and mutant population). (M,N) The average percentage of intersegmental veins (M) and arteries (N) does not differ between genotypic classes in an incross of prox1ai278 carriers. (O) In prox1ai278 mutants, the average number of ISVs is not altered. Error bars represent s.d. n.s., not statistically significant.
|
