
Fig. S2
- ID
- ZDB-FIG-140421-17
- Publication
- Zigman et al., 2014 - Hoxb1b controls oriented cell division, cell shape and microtubule dynamics in neural tube morphogenesis
- Other Figures
- All Figure Page
- Back to All Figure Page
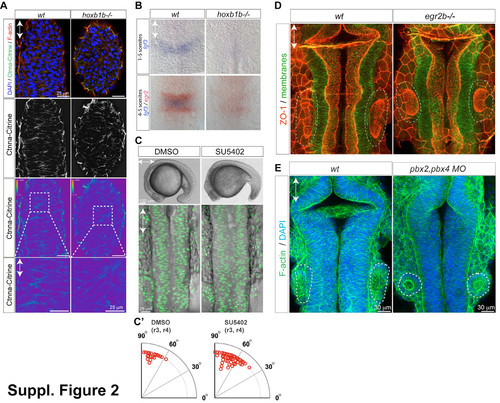
Hindbrain morphogenesis defects in hoxb1b/ mutants is not due to reduced cell-cell adhesion, lack of FGF signaling, or lack of rhombomere boundaries. (A) Ctnna-Citrine (green), F-actin (red) and DNA (blue) in the dorsal neural keel r3/4 level at 15 hpf demonstrating normal levels and distribution of Ctnna in hoxb1b/. Lower panels: Ctnna-Citrine channel shown in pseudocolours. Levels in wild-type and mutant are normalized to the level in the enveloping layer visible in the periphery of the z-section, which is not expected to be affected by hoxb1b loss. (B) Decreased expression of fgf3 mRNA expression (blue) in hoxb1b/ compared to control siblings. (C) Live embyos incubated in SU5402 (100 microM) from the 1 somite stage onward have defective tail outgrowth (top panels) but no defect in hindbrain morphogenesis (lower panels, Tg(h2a.f/z-GFP) marks nuclei). (C2) Blocking FGF signaling does not disrupt the predominantly apico-basal orientation of cell division in the neural keel, quantitated as in Fig. 3. (D) Normal hindbrain lumen morphogenesis in 22 hpf egr2/ embryos based on ZO-1 staining (neuroepithelial apical surface). (E) Normal hindbrain morphology in pbx2;pbx4 double morphants based on phalloidin staining (F-actin) at 21 hpf. Anterior-posterior axis is indicated by double arrows; otic vesicles at the level of r5 are circled by a dashed line. |