
Fig. 5
- ID
- ZDB-FIG-140324-18
- Publication
- Wang et al., 2013 - Impact of a combined high cholesterol diet and high glucose environment on vasculature
- Other Figures
- All Figure Page
- Back to All Figure Page
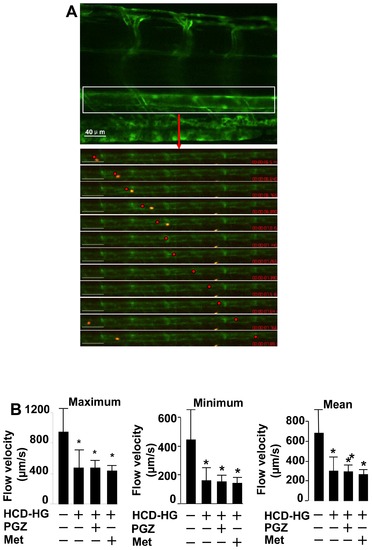
HCD-HG treatment led to reduced velocity of blood flow. A: Velocity of the blood flow in the caudal aorta (CA) was measured. An example of the red blood cell tracking was present in the CA. Each cell was tracked for more than 10 time points, and corresponding frames were produced; motion trajectory was estimated. Relative time and distance were used for the calculation of the velocity. Upper panel scale bar:40 μm; the beneath panel scale bar: 80 μm. B: The values of maximum, minimum, and mean velocities were compared between normal and HCD-HG treated group, HCD-HG treated group and HCD-HG+ pioglitazone or metformin group respectively by Student′s t test (n>5 in each group). Asterisk (*): Comparison of flow velocity between control group and corresponding groups, p<0.05. |
| Genes: | |
|---|---|
| Fish: | |
| Anatomical Terms: | |
| Stage: | Days 14-20 |
| Fish: | |
|---|---|
| Conditions: | |
| Observed In: | |
| Stage: | Days 14-20 |