|
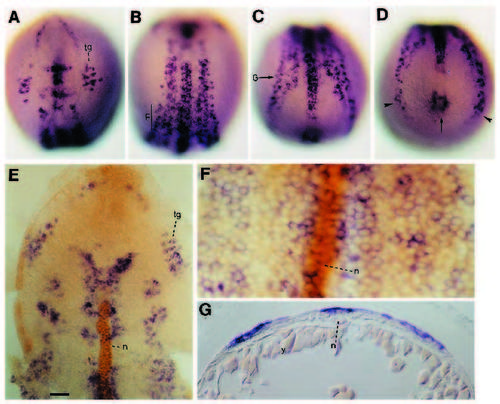
ngn1 is expressed broadly in distinct domains in the neural plate. (A-D) Dorsal views of an embryo at the 3-somite stage showing ngn1 expression. Orientation is anterior up; (A) view onto anterior neural plate; (B) view onto neural plate at the posterior hindbrain/anterior trunk level; (C) view onto neural plate at trunk level; (D) view onto tail bud. Expression is detected in the center (arrow) and lateral aspects of the tailbud (arrowheads). (E,F) Flat preparations of 3-somite embryos showing ngn1 expression (purple) and anti-Notail antibody (brown) marking the nuclei of the notochord (n). E shows a flat preparation of the anterior neural plate while F shows an area at the trunk level as indicated by line, F in B. View onto neural plate, anterior up. (G) Transverse section through 3-somite stage embryo at the level indicated by arrow marked G in C. Dorsal is up. Abbreviations: tg, trigeminal ganglion; n, notochord; y, yolk. Scale bar represents 50 μm in A-E; 12 μm in F and G.
|