
Fig. 1
- ID
- ZDB-FIG-140113-9
- Publication
- Rohs et al., 2013 - Neuronal Expression of Fibroblast Growth Factor Receptors in Zebrafish
- Other Figures
- All Figure Page
- Back to All Figure Page
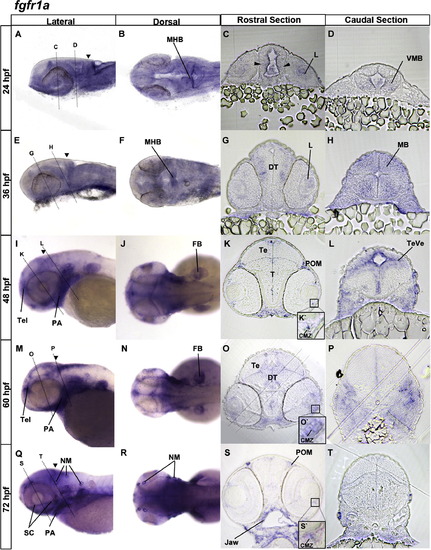
In situ hybridization of fgfr1a gene expression. In situ hybridization of fgfr1a gene expression at 24 hpf (A–D), 36 hpf (E–H), 48 hpf (I–L), 60 hpf (M–P), and 72 hpf (Q–T). Lateral views (A, E, I, M, Q) with anterior to the left, dorsal at the top, dorsal views (B, F, J, N, R) with anterior to the left, rostral transverse brain sections (C, G, K, O, S), and caudal transverse brain sections (D, H, L, P, T). Dotted lines indicate approximate orientation of imaged sections. Solid arrowheads indicate the location of the midbrain–hindbrain boundary. Arrowheads in C point to weak brain expression. Labels point to expression in the ciliary marginal zone (CMZ), dorsal thalamus (DT), fin bud (FB), jaw (J), lens (L), midbrain (MB), midbrain–hindbrain boundary (MHB), midbrain tegmentum (T), neuromasts (NM), optic tectum (Te), pharyngeal arches (PA), periocular mesenchyme (POM), splanchnocranium (SC), tectal ventricle (TeVe), telencephalon (Tel), and ventral midbrain (VMB). |
Reprinted from Gene expression patterns : GEP, 13(8), Rohs, P., Ebert, A.M., Zuba, A., and McFarlane, S., Neuronal Expression of Fibroblast Growth Factor Receptors in Zebrafish, 354-61, Copyright (2013) with permission from Elsevier. Full text @ Gene Expr. Patterns