
Fig. 2
- ID
- ZDB-FIG-131220-20
- Publication
- Peyric et al., 2013 - Circadian clock regulation of the cell cycle in the zebrafish intestine
- Other Figures
- All Figure Page
- Back to All Figure Page
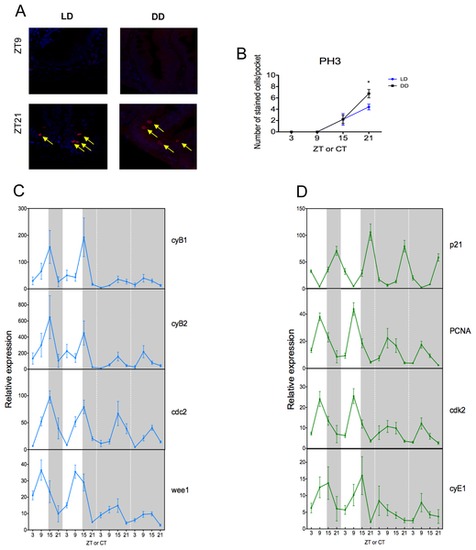
Figure 2. M phase is rhythmic and under circadian control. (A) In LD and DD conditions, cells stained with an anti-pH3 antibody to monitor mitosis (in red and marked by the yellow arrow) at the peak and trough time points, are localized inside the intervillus pockets of the gut. (B) Cell division is rhythmic and is exhibiting a peak of stained cells per pocket at ZT21. This rhythmicity is maintained in DD, showing that cell division is under circadian control. DAPI is used here as a nuclear counterstain. (C–D) Quantitative PCR analysis of endogenous cell cycle genes from M phase (C) and G1/S phase (D). (C) In LD, cyB1, cyB2 and cdc2 are rhythmic and peak at ZT15, whereas wee1 peaks at ZT9. All genes continue to oscillate after entry into DD. (D) In LD, p21, PCNA and cdk2 show a strong rhythm with peak expression at ZT9 for PCNA and cdk2 and a peak at ZT21 for p21. In DD, all genes continue to oscillate robustly with the possible exception of cyE1, which shows quite variable expression even in LD. White and grey backgrounds represent light and dark phases, respectively. Cell cycle gene expression data represents the mean ± SEM from 8 fish per time point. For each time point in panel B, LD data are compared to DD using a Student’s t-test (* p<0.05). All other data are expressed as mean ± SEM. |