
Fig. 3
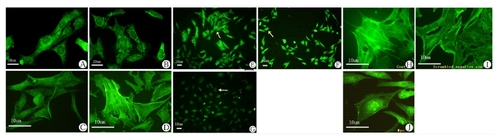
Myo1e and F-actin expression in cultured podocytes. A) Myo1e expression in proliferative MPC5 at 33°C. B) Myo1e expression in differentiated MPC5 at 37°C. C) F-actin expression in proliferative MPC5 at 33°C. D) F-actin expression in differentiated MPC5 at 37°C. E) Myo1e expression in MPC5 (control). F) Myo1e expression in MPC5 (scrambled negative control). G) Myo1e expression in MPC5 after shRNA knock-down. Arrow: Myo1e expression was down-regulated in G than that in E & F.H) F-actin expression in controlled podocytes. I) F-actin expression in scrambled negative control podocytes. J) Change of F-actin organization in MYO1E knock-down podocytes. |