
Fig. 6
- ID
- ZDB-FIG-130905-10
- Publication
- Mandal et al., 2013 - Transgenic retinoic acid sensor lines in zebrafish indicate regions of available embryonic retinoic acid
- Other Figures
- All Figure Page
- Back to All Figure Page
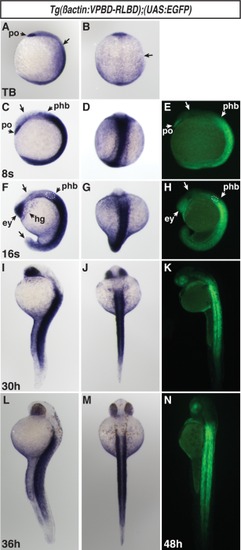
Expression in Tg(β-actin:VPBD-RLBD);(UAS:EGFP) embryos is consistent with the domains of RA-producing and -degrading enzymes. A, B: VP16-RA sensor expression at the TB stage. Arrowhead indicates strong expression in the polster (po). Arrows in A and B indicate the border between the posterior reporter expression and the anterior of the embryo, which lacks reporter expression. C–E: VP16-RA sensor expression via ISH and fluorescence at the 8s stage. Expression is maintained in the polster (po) and is largely absent in the anterior brain (arrows in C and E). There is strong expression throughout the posterior. Lower levels of expression extend into the posterior hindbrain (phb). F–H: VP16-RA sensor expression via ISH and fluorescence at the 16s stage. There is expression in the eyes (ey) and anterior brain, hatching gland (hg), and posterior hindbrain. Expression extends into the posterior hindbrain up to the otic vesicle (dashed outlines in F and H), which forms at the rhombomeres 5 and 6. Expression is absent in the brain and tip of the tail (arrows in F and H). I–K: RA reporter expression via ISH and fluorescence at 30 hpf. L, M: VP16-RA sensor expression via ISH at 36 hpf. N: VP16-RA sensor expression via fluorescence at 48 hpf. A, D, F, G, I, J, L, M, O are lateral views. B, E, H, K, N are dorsal views. In all images anterior is up. |