
Fig. 6
- ID
- ZDB-FIG-130213-19
- Publication
- Lalwani et al., 2012 - Reverse Genetics Screen in Zebrafish Identifies a Role of miR-142a-3p in Vascular Development and Integrity
- Other Figures
- All Figure Page
- Back to All Figure Page
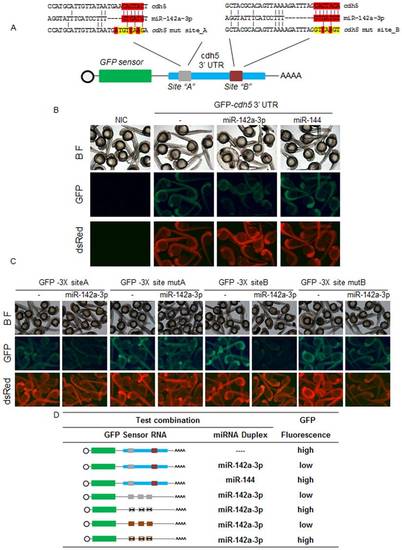
In zebrafish, miR-142a-3p regulates cdh5 via its two predicted binding sites. A - Schematic of GFP-cdh5 3′UTR transcript containing two miR-142a-3p predicted binding site (site “A”, grey; site “B”, brown). Predicted miRNA seed sequences binding sites are enlarged and boxed in red. Selected nucleotides were mutated in the seed region for destroying miR-142a-3p binding site is displayed in yellow color. B and C - Silencing effect of miR-142a-3p on the series of sensor mRNA encoding GFP fused to various test 3′UTRs (as tabulated in panel D). B - Co-injection of the miR-142a-3p and GFP-cdh5 32UTR mRNA leads to suppression of GFP expression in wildtype zebrafish embryos. C – Co-injection of miR-142a-3p with various test combinations of GFP sensor fused to the miR-142a-3p seed sequence binding sites, engineered in triplicates. Strong miR-142a-3p induced suppression of GFP expression was observed with both the predicted binding sites (GFP-32UTR3X site A and GFP-32UTR3X site B). However, suppression was relieved on mutating the binding sites (GFP-32UTR3X mut site A and GFP-32UTR3X mut site B). Bright-field image of embryos are shown in the upper row of each panel. DsRed mRNA was co-injected with the test transcripts as a control and is shown in the lower row of each panel. In the middle row of each panel various GFP-32UTR sensor RNA and miRNA combinations were tested as labeled. Expressions of the reporters were analyzed at 26 to 28 hours post fertilization. Group images of embryos that were co-injected of various GFP- 32UTR mRNA and miR-142a-3p are compared with embryos receiving respective GFP-3′ UTR sensor only. Clutch of representative embryos (7–9 embryos in each image) were photographed together in a single image to ensure valid comparison of relative green fluorescent intensity between two groups. The images are taken at 2.5× magnification. D - Various combinations of GFP sensor and miRNA were tested and scored using a comparative scale for GFP intensity and are represented either as high or low. The colour schemes of the cdh5 3′ UTR variants follow those mentioned in Figure 6A. The black “X” indicates a mutated miR-142a-3p site. The bioactivity of GFP-Sensor with 4X miR-142a-3p perfect complimentary target (PT) sites and miRNA duplex is shown in Supplementary Figure S5. |