
Fig. S2
- ID
- ZDB-FIG-130213-11
- Publication
- Lalwani et al., 2012 - Reverse Genetics Screen in Zebrafish Identifies a Role of miR-142a-3p in Vascular Development and Integrity
- Other Figures
- All Figure Page
- Back to All Figure Page
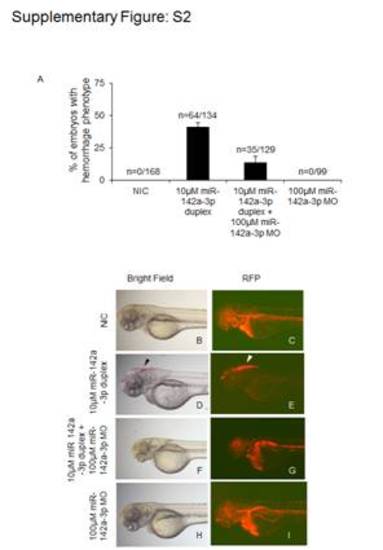
Rescue of miR-142a-3p duplex induced hemorrhage phenotype in zebrafish embryos using antisense morpholino targeting to the mature form of miR-142a-3p. A - Bar graph showing cerebral hemorrhage phenotype in non-injected control (NIC); 10 μM miR-142a-3p duplex injected; co-injection of 10 μM miR-142a-3p duplex with 100 μM miR-142a-3p morpholino (MO); and 100 μM miR-142a-3p MO injected Tg(fli1:EGFP, gata1a: dsRed) zebrafish embryos at 2dpf. Data is represented as mean percentage ± SD (standard deviation) collected over 3 independent experiments. n represents the number embryos analyzed. B-I - Representative images of cerebral hemorrhage phenotype in Tg(fli1:EGFP, gata1a: dsRed) zebrafish embryos at 2 dpf. B and C - NIC embryos. D and E - 10 μM miR-142a-3p duplex injected embryos. F and G – Embryos receiving co-injection of 10 μM miR-142a-3p duplex with 100 μM miR-142a-3p MO. H and I - 100 μM miR-142a-3p MO injected embryos. The embryos were imaged at 2.5× magnification. Arrowheads indicate the site of hemorrhage. |