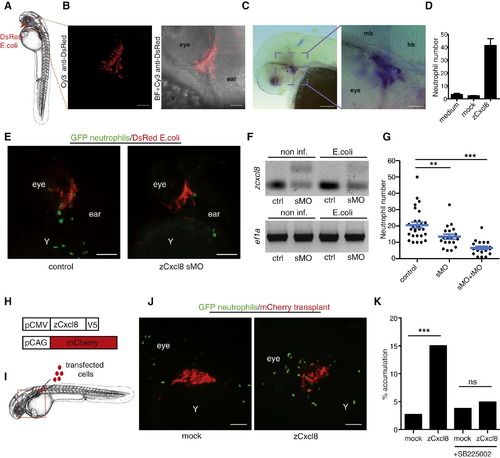
zCxcl8 Is Necessary and Sufficient to Instruct Neutrophil Migration(A) Diagram of zebrafish larva at 2 dpf. Arrow indicates site of E. coli injection. Square denotes area viewed in (B).(B) DsRed-expressing E. coli was detected by immunofluorescence at 2 hr postinfection (hpi). Fluorescence is shown alone or overlaid on bright-field image (BF). Scale bars represent 25 μm.(C) In situ hybridization of zcxcl8 mRNA at 2 hpi. Scale bars represent 100 μm (left) and 20 μm (right). mb, midbrain; hb, hindbrain.(D) In vitro chemotactic response of adult zebrafish neutrophils to conditioned media from zCxcl8 or mock-transfected HEK293T cells, in a transwell assay. Number of transmigrated neutrophils was measured by flow cytometry and normalized to the same number of calibration beads. Data are means of triplicate samples, representative of four experiments. Error bar represents SEM.(E) SDCM images of neutrophils within live larvae treated or not treated with splice-blocking zcxcl8 morpholino (sMO) at 1 hpi. Y, yolk sac. Scale bars represent 100 μm.(F) RT-PCR of zcxcl8 mRNA, from larvae treated or not treated with splice-blocking zcxcl8 morpholino (sMO), performed at 2 hpi. ef1a is a loading control.(G) Neutrophil recruitment to E. coli in larvae treated or not treated with splice (sMO) or combined splice and translation-blocking (sMO+tMO) zcxcl8 morpholinos, quantified at 2 hpi (control: n = 29 larvae; sMO: n = 19; sMO+tMO: n = 20 larvae, three independent experiments). Error bars indicate SEM. p < 0.01; p < 0.0001 (Mann-Whitney test).(H) zCxcl8-V5 and mCherry expression constructs.(I) Transplantation site of transfected HEK293T cells. The square indicates the area imaged.(J) SDCM images of neutrophils within live larvae 1 day after transplantation with mCherry-transfected HEK293T cells, cotransfected (zCxcl8) or not cotransfected (mock) with zCxcl8. Y, yolk sac. Scale bars represent 100 μm.(K) Percentage of neutrophil tracks reaching the transplant out of all tracks in the imaged area. Mock: n = 568; zCxcl8: n = 1,378; mock+SB225002: n = 156; zCxcl8+SB225002: n = 182. p < 0.0001 (Fisher′s exact test for cells reaching or not transplant). Data are pooled from three to four larvae per group originating from two or three independent experiments.See also Figure S1 and Movie S1.
|
