zCxcl8 Guides Neutrophils as HSPG-Bound Gradients (Related to Figure 4)
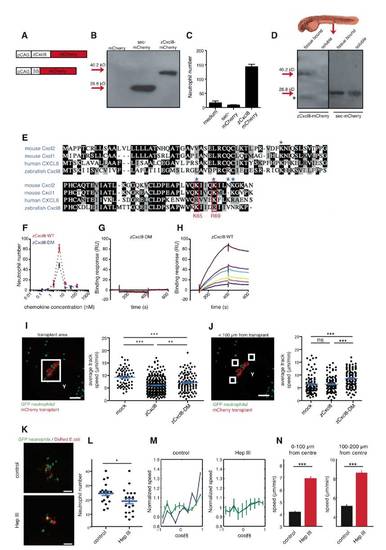
(A) zCxcl8-mCherry and sec-mCherry expression constructs. SS, zCxcl8 signal sequence (amino acids 1-22).
(B) Western blot detection of mCherry in culture supernatants of HEK293T cells, transfected with mCherry, sec-mCherry and zCxcl8-mCherry.
(C) In vitro chemotactic response of adult zebrafish neutrophils to concentrated conditioned media from sec-mCherry or zCxcl8-mCherry-transfected HEK293Ts.
(D) Western blot detection of mCherry in extracts of 2 dpf larvae ubiquitously expressing injected zCxcl8-mCherry or sec-mCherry mRNA. Supernatants of dissociated larvae represent „soluble fractions whilst residual larval extracts represent „tissue bound fractions. Pools of 15 larvae. *, mCherry degradation product.
(E) Alignment of amino acid sequences of human CXCL8, zebrafish zCxcl8, mouse CXCL1 and CXCL2, indicating conserved HSPG-binding residues (blue asterisks) and the residues that were mutated to alanines for construction of double mutant zCxcl8 (in red boxes).
(F) In vitro chemotactic response of adult zebrafish neutrophils to wild-type zCxcl8 (zCxcl8-WT) and double mutant zCxcl8 (zCxcl8-DM). Data representative of three experiments.
(G and H) Sensograms showing the binding of increasing concentrations (brown, 1 μM; violet, 0.75 μM; turquoise, 0.5 μM; yellow, 0.37 μM; pink, 0.25 μM; blue, 0.18 μM) of zCxcl8-DM (G) or zCxcl8 (H) to immobilized heparan sulfate. Data representative of three experiments.
(I) (Left) Representative SDCM reference image of neutrophils (green) within the area of transplanted cells (red). Cube indicates example area, such that was used for motility analysis shown right. (Right) Average track speed in the presence or absence of zCxcl8 or zCxcl8-DM. mock: n=66; zCxcl8: n=290; zCxcl8-DM=110 (Mann Whitney test). Y, yolk sac.
(J) (Left) Representative SDCM image of neutrophils (green) within the area of transplanted cells (red). Cubes indicate example areas within < 100 μm from the transplant, such that were used for the analysis shown right. (Right) Average track speed in the presence of absence of zCxcl8 or zCxcl8-DM. mock: n=92; zCxcl8: n=97; zCxcl8-DM=95 (Mann Whitney test). Y, yolk sac.
(K and L) Neutrophil recruitment to E. coli within larvae treated with Heparinase III (Hep III) or buffer (control). (K) SDCM images at 75 min after infection. (L) Neutrophil recruitment to E. coli quantified at 2 hpi. Control: n= 19; Hep III: n= 21 larvae (Student′s t test). Data representative of four independent experiments.
M) Evolution of the average normalized speed with the orientation of motion. Blue color is associated to cells inside a radius of 100 μm and green color is associated to the complete set of cells. Note the strong differences between the green and blue curve for the control (left) and the almost identical evolution for heparinase-treated larvae (Hep III) (right).
(N) Average speed values of the cells inside a radius of 100μm (left) and between radius of 100 μm and 200 μm (right).
Error bars, SEM. ns, not significant; *p < 0.05; **p < 0.01; ***p < 0.0001. Data in I, J, M, N are pooled from 3-4 larvae per group in 2-4 experiments. Scale bars, 100 μm (I and J) and 50 μm (K).
|
