ZFIN ID: ZDB-FIG-130109-22 |
Gene: | |
---|---|
Fish: | |
Knockdown Reagents: | |
Anatomical Term: | |
Stage: | Shield |
Fish: | |
---|---|
Knockdown Reagents: | |
Observed In: | |
Stage Range: | Shield to 75%-epiboly |
Fig. 4 
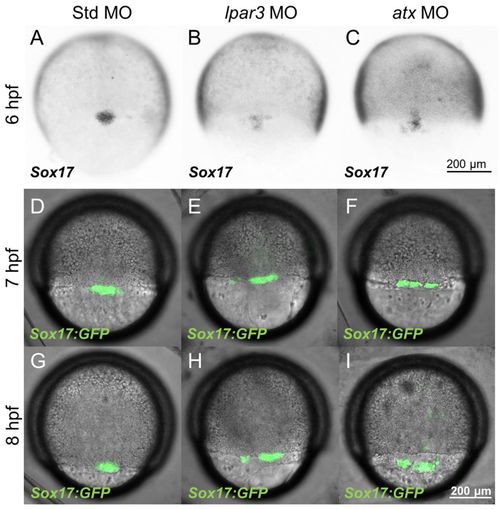
DFC clustering is disturbed in lpar3 and atx morphants during epiboly. (A-C) Zebrafish embryos injected with the indicated MOs were subjected to WISH against sox17 at 6 hpf. In contrast to the ovoid-shaped DFCs cluster in Std MO-injected embryos (A), dispersed DFC clusters were observed in both lpar3 (B) and atx (C) morphants. (D-I) Tg (sox17:GFP) embryos were MO injected, cultured to 7 hpf and 8 hpf, and photographed under epifluorescence DIC microscopy. The DIC and epifluorescence images are superimposed and presented. More spread-out and linear-shaped DFCs were observed in both lpar3 (E,H) and atx (F,I) morphants compared with Std MO-injected embryos (D,G). |
Gene | Antibody | Fish | Conditions | Stage | Anatomy | Assay |
---|---|---|---|---|---|---|
sox17 | AB | control | Shield | forerunner cell group | ISH | |
AB + MO2-lpar3 | standard conditions | Shield | forerunner cell group | ISH | ||
AB + MO5-enpp2 | standard conditions | Shield | forerunner cell group | ISH |
Acknowledgments: | This image is the copyrighted work of the attributed author or publisher, and ZFIN has permission only to display this image to its users. Additional permissions should be obtained from the applicable author or publisher of the image. Full text @ Development |
---|