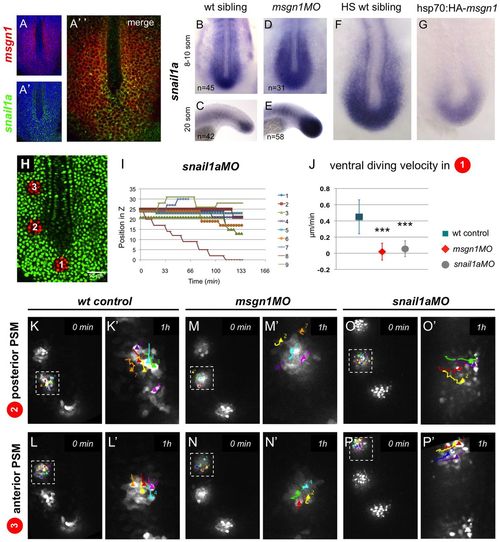
Msgn1 regulates snail1a expression. (A-A′′) Double fluorescent in situ hybridisation for msgn1 (red) and snail1a (green) in a 10-somite stage wt zebrafish embryo, as seen in confocal section. (B-E) Expression of snail1a is increased in msgn1MO morphants (D,E) compared with sibling controls (B,C). (F,G) Expression of snail1a is decreased in hsp70:HA-msgn1 embryos (G) compared with sibling controls (F) at 1 hpHS. (H) An 8-somite stage Kaede-injected embryo with freshly photoactivated cells (red) in the superficial layer of the MZ (region 1), in the posterior PSM (region 2), and in the anterior PSM (region 3). (I) z-position of individual cells photoactivated in region 1 in snail1aMO morphants, tracked over time. Each colour represents an individual cell. Compare with Fig. 5D,H. (J) Mean ventral diving velocities of cells marked by photoactivation in region 1, comparing wt control, msgn1MO and snail1aMO morphants. Mean ± s.d., ***P<0.0005 versus wt controls (t-test). (K-P2) Still images showing the tracks of posterior and anterior PSM photoactivated cells in wt control (K-L′), msgn1MO-injected (M-N′) and snail1aMO-injected (O-P′) embryos. The boxed regions in K-P are magnified in K′-P′. Scale bar: 50 μm.
|
