
FIGURE
Fig. 1
- ID
- ZDB-FIG-121011-26
- Publication
- Anchelin et al., 2011 - Behaviour of Telomere and Telomerase during Aging and Regeneration in Zebrafish
- Other Figures
- All Figure Page
- Back to All Figure Page
Fig. 1
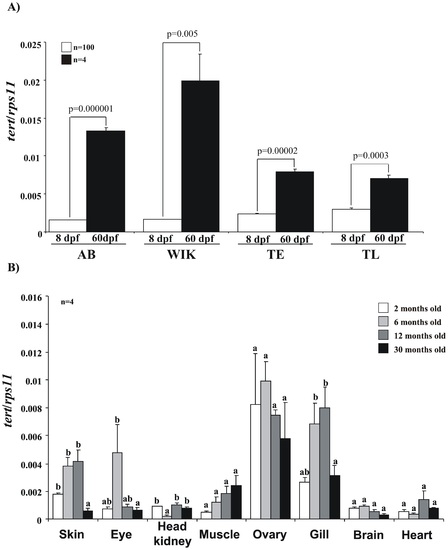
Dynamic of TERT gene expression in the zebrafish. The mRNA levels of tert gene were determined by real-time RT-PCR in larval and juvenile stages of the indicated genotypes (A) and in different tissues of 2-30 month-old fish of the AB genotype. Gene expression is normalized against rps11. Each bar represents the mean ± S.E. from 100 pooled animals for larvae and 4 individual fish for all the rest (A,B) and triplicate samples. |
Expression Data
| Gene: | |
|---|---|
| Fish: | |
| Anatomical Terms: | |
| Stage Range: | Days 7-13 to Adult |
Expression Detail
Antibody Labeling
Phenotype Data
Phenotype Detail
Acknowledgments
This image is the copyrighted work of the attributed author or publisher, and
ZFIN has permission only to display this image to its users.
Additional permissions should be obtained from the applicable author or publisher of the image.
Full text @ PLoS One