
Fig. S2
- ID
- ZDB-FIG-120601-21
- Publication
- Chablais et al., 2012 - The regenerative capacity of the zebrafish heart is dependent on TGFβ signaling
- Other Figures
- All Figure Page
- Back to All Figure Page
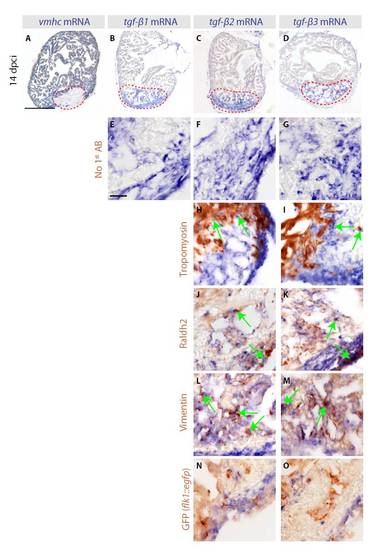
The expression of three TGFβ ligands is induced in an overlapping pattern at the post-infarct zone. (A-D) In situ hybridization of consecutive heart sections with vmhc, tgfb1, tgfb2 and tgfb3 mRNA antisense probes (blue staining) of cryoinjured hearts at 14 dpci. Red dashed lines demarcate the cryoinjured areas. (A) The absence of vmhc mRNA demarcates the infarct area. (B-D) tgfb1, tgfb2 and tgfb3 are upregulated in the injured area at 14 dpci. Scale bar: 300 μm. (E-O) In situ hybridization using tgfb1, tgfb2 and tgfb3 mRNA antisense probes (blue staining) followed by immunohistochemistry (brown) of heart sections at 14 dpci. Scale bar: 50 μm. (E-G) A control of immunohistochemistry without incubation with primary antibodies. As expected, no brown staining is detected. (H-O) Various primary antibodies were used to label different cell types of the heart (brown). Arrows indicate double-positive cells. (H,I) tgfb2 and tgfb3 are not expressed in the Tropomyosin-stained myocardium, except for a thin layer of cardiomyocytes adjacent to the infarct boundary. (J,K) Raldh2-positive epicardial cells invading the injured area are co-labeled with tgfb2 and tgfb3 staining. (L,M) Vimentin-positive fibroblasts of the post-infarct overlap with tgfb2 and tgfb3 staining. (N,O) Endothelial cells labeled by GFP expression of transgenic fish (flk1::egfp) do not express tgfb2 and tgfb3. The equivalent data for tgfb1 are shown in Fig. 1. |