
Fig. 2
- ID
- ZDB-FIG-120328-5
- Publication
- Zhao et al., 2012 - Kinesin-2 family in vertebrate ciliogenesis
- Other Figures
- All Figure Page
- Back to All Figure Page
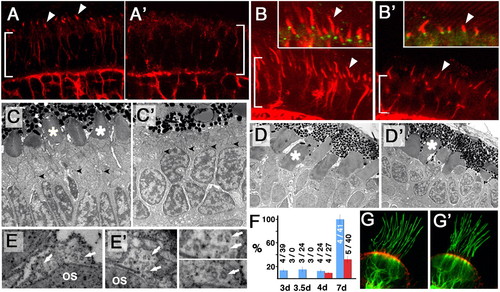
A subset of cilia differentiate in kif3b mutant embryos. (A, A′, B, and B′) Transverse cryosections through the photoreceptor cell layer (bracket) in WT (A and B) and jj203 mutant (A′ and B′) embryos stained with anti-acetylated tubulin antibody (red) at 3 dpf (A and A′) and 5 dpf (B and B′). (C and D′) EM images of sections through WT (C and D) and jj203 mutant (C′ and D′) photoreceptor cells at 3 dpf (C and C′) and 5 dpf (D and D′). (E and E′) EM images of sections perpendicular to outer segment (OS) microtubules in WT (E) and mutant (E′) photoreceptors. Arrows point to microtubule singlets. Enlargements are shown to the right: mutant (Upper) and WT (Lower). (F) The length of the connecting cilium in WT (blue bars) and mutant (red bars) retinae expressed as the percentage of WT length at 7 dpf. Measurements were performed on confocal images of transverse cryosections stained with anti-acetylated tubulin antibody. Data were collected at 3, 3.5, 4, and 7 dpf as indicated. Sample sizes (number of retinae/number of cilia) are provided. (G and G′) Confocal images of cilia in ear cristae of WT (G) or mutant (G′) embryos stained with anti-acetylated tubulin antibody (in green) and counterstained with phalloidin (in red) at 7 dpf. |
| Fish: | |
|---|---|
| Observed In: | |
| Stage Range: | Protruding-mouth to Days 7-13 |