
Fig. 1
- ID
- ZDB-FIG-111117-13
- Publication
- Xi et al., 2011 - Transgenic zebrafish expressing green fluorescent protein in dopaminergic neurons of the ventral diencephalon
- Other Figures
- All Figure Page
- Back to All Figure Page
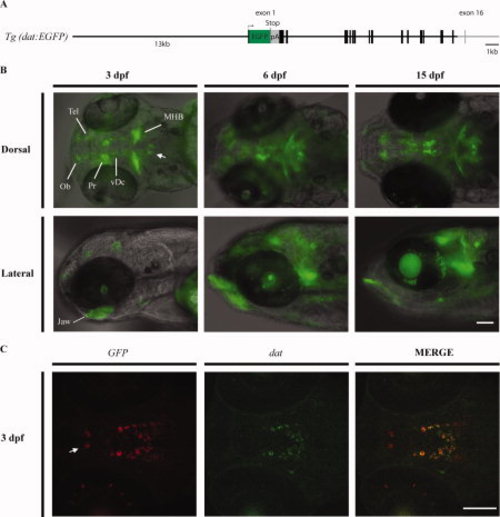
The Tg(dat:EGFP) line. A: A schematic map of the DNA fragment used in Tol2-based dat transgenesis. The total size of the inserted DNA is 27 kb, containing the whole dat genomic sequence except for the last coding exon and 32-flanking region. EGFP (in green) was inserted in frame at the beginning of exon 1. A stop codon and a polyadenylation signal sequence (pA) at the end of green fluorescent protein (GFP) are indicated. B: Reporter gene expression in Tg(dat:EGFP) larvae. A composite of different fluorescent focal planes was generated using the Image Pro software and merged with bright field image. MHB, midbrain–hindbrain boundary; Ob, olfactory bulb; Pr, pretectum; Tel, telencephalon; vDc, ventral diencephalon. The arrow indicates a group of cells in the hindbrain that express GFP and may correspond to some of the dat-expressing cells reported by Holzschuh et al. (2001). C: Double fluorescent in situ hybridization on 3 days post-fertilization (dpf) larvae with GFP (red) and dat (green) cRNA probes. The arrow indicates a group of cells in the preoptic area that express the transgene and th (not shown) but not dat. Scale bars = 100 μm. |
| Genes: | |
|---|---|
| Fish: | |
| Anatomical Terms: | |
| Stage Range: | Protruding-mouth to Days 14-20 |