
Fig. 1
- ID
- ZDB-FIG-110804-59
- Publication
- Saito et al., 2011 - Isolation and cytogenetic characterization of zebrafish meiotic prophase I mutants
- Other Figures
- All Figure Page
- Back to All Figure Page
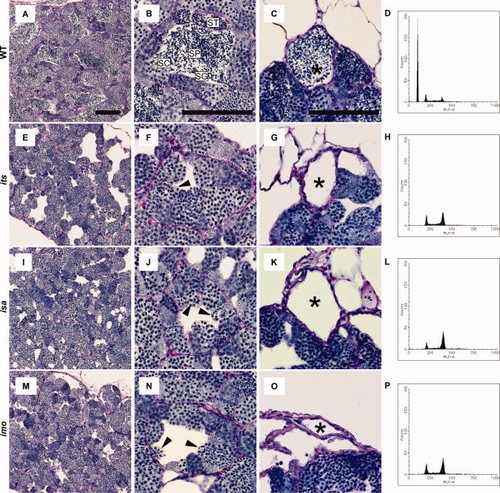
Histology and fluorescence-activated cell sorter (FACS) profiles of its, isa, and imo mutant testes. A–O: Testes sections from 3-month-old wild-type (A–C), its (E–G), isa (I–K), and imo (M–O) were stained with periodic acid Schiff and hematoxylin. A,E,I,M: Gross appearance of wild-type and mutant testes. Mutant tubules show gaps in the intertubular space. B,F,J,N: Seminiferous tubules in wild-type and mutant showing spermatogenic cysts containing different types of germ cells; spermatogonia (SG), spermatocytes (SC), spermatids (ST), and sperm (SP). Note the absence of spermatids and sperm and the presence of germ cells with condensed nuclei in the mutant testes (arrowheads). C,G,K,O: The efferent ducts of each mutant contain no sperm. Scale bars = 100 μm. D,H,L,P: Representative FACS profiles in the wild-type (D), its (H), isa (L), and imo (P) testis. Cell types in the various peaks are (1C) sperm and spermatids; (2C) spermatogonia, secondary spermatocytes, and somatic cells; and (4C) primary spermatocytes and G2/M spermatogonia and somatic cells. Each panel is representative of three zebrafish with data. Note the absence of 1C and the increase in 2C and 4C cells in each mutant testis, compared with the wild-type testis (D). |
| Fish: | |
|---|---|
| Observed In: | |
| Stage: | Adult |