
Fig. 3
- ID
- ZDB-FIG-101207-5
- Publication
- Choi et al., 2010 - In vivo development of dendritic orientation in wild-type and mislocalized retinal ganglion cells
- Other Figures
- All Figure Page
- Back to All Figure Page
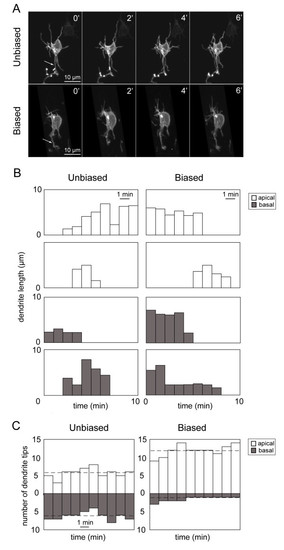
Dynamic behavior of apical and basal dendrites of developing retinal ganglion cells. (A) Example of a time-lapse recording (time elapsed in minutes) from an ′unbiased′ and a ′biased′ RGC showing extension and retraction of processes. Arrows indicate axons. (B) Examples of the dynamic behavior of individual apical dendrites (white) and basal dendrites (grey) over time showing dendritic length over time and dendritic lifetimes. Motility rates (Figure 4) of individual dendrites were calculated from such plots. (C) Examples showing how the numbers of apical and basal tips change over time (10 minutes of recording). Shown here are the plots for a cell with an unbiased arbor and a cell with a biased arbor. The dotted line indicates the average number of apical or basal dendrites of the cell during the recording period. |