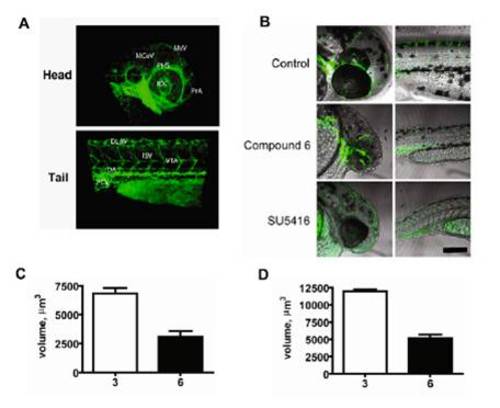
Labeling of the Tg:fli1-egfp zebrafish vasculature and quantification of the drug treatment effect on the intersegmental vessel volume. (A) Images are taken from Fig. 3A with major vascular structures labeled. In the head: MCeV, middle cerebral vein; MsV, mesencephalic vein; PHS, primary head sinus; IOC, inner optic circle; PrA, prosencephalic artery. In the tail: DLAV, dorsal longitudinal anastomotic vessel; DA, dorsal aorta; PCV, posterior cardinal vein; ISV, intersegmental vessel; VTA, vertebral artery. (B) Representative views of zebrafish embryos treated as in Fig. 3A (images represent merged phase and GFP fluorescence views of the head and trunk regions of Tg:fli1-EGFP embryos). (Scale bar, 200 μm.) (C) Quantification of ISV volume from embryos treated as in Fig. 3A. (D) Quantification of ISV volume from embryos treated as in Fig. 3B. To measure the ISV volume, individual ISVs were digitally isolated using the Imaris countersurface/isosurface functions. Thirty independent ISVs from four independent embryos were used for the measurement. Reported � SEM.
|
