
Fig. 1
- ID
- ZDB-FIG-100723-24
- Publication
- Khatib et al., 2010 - Zebrafish ProVEGF-C Expression, Proteolytic Processing and Inhibitory Effect of Unprocessed ProVEGF-C during Fin Regeneration
- Other Figures
- All Figure Page
- Back to All Figure Page
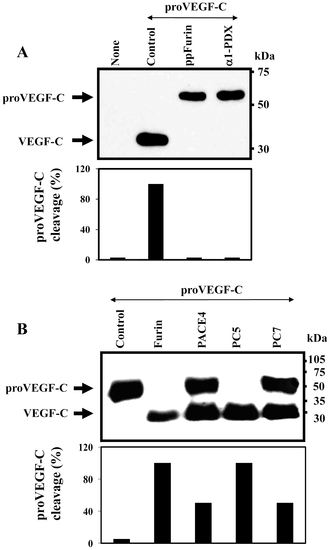
Processing of zebrafish proVEGF-C. (A) Processing of proVEGF-C was analyzed by Western blotting in zebrafish ZF4 cells transiently cotransfected with pSecTagB (Myc tag) vector containing the zebrafish proVEGF-C cDNA and the empty pIRES2-EGFP vector (Control) or pSecTagB expressing proVEGF-C and pIRES2-EGFP containing the PCs inhibitors; ppFurin or α1-PDX. Results of band intensities are shown in the bar graph that were deduced from the ratio of VEGF-C/(pro-VEGF-C + VEGF-C). Results are representative of three experiments. (B) The processing of proVEGF-C was analyzed by Western blotting using anti-Myc antibody on media derived from PCs-deficient LoVo cells transiently cotransfected with either pIRES2-EGFP vector alone and pSecTagB (Myc tag) containing the zebrafish VEGF-C cDNA (Control) or pIRES2-EGFP vector containing Furin, PACE4, PC5 or PC7 cDNA. The corresponding percentages of band intensities were deduced from the ratio of VEGF-C/(proVEGF-C+VEGF-C). Results are representative of three experiments. |