|
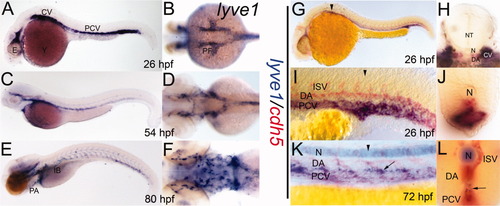
A-F: lyve1 riboprobe labeled developing lymphatic endothelial cells in 26 (A,B), 54 (C,D), and 80 (E,F) hours postfertilization (hpf) embryos (A,C,E, lateral view; B,D,F, dorsal view of anterior aspect). G-L: Double staining with lyve1 (blue) and cdh5 (red) riboprobes. G-J at 26 hpf; K,L at 72 hpf; G,I,K lateral views; H,J,L transverse sections approximately at the level of black arrowheads. K,L: The lyve1 expression within the developing thoracic duct (arrows). Background label within the notochord (N) due to extended staining time. CV, cardinal vein; DA, dorsal aorta; E, eye; IB, intestinal bulb; ISV, intersegmental vessels, NT, neural tube; PF, pectoral fin bud; PA, pharyngeal arches; PCV, posterior cardinal vein; Y, yolk.
|