
FIGURE
Fig. S2
Fig. S2
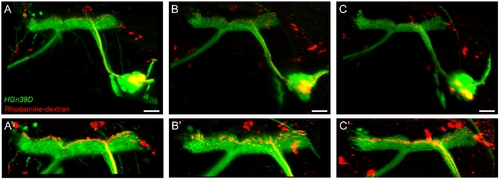
A-C: Somata and central projections of neurons innervating: caudal (Nterm) (A), middle (N4) (B), and rostral (N1) (C) neuromasts, after rhodamine-dextran injection in a 6-day-old HGn39D transgenic fish. EGFP and rhodamine-dextran fluorescent signal are depicted in green and red respectively. A′-C′: Detail of the central projections shown in A-C. Rhodamine-dextran levels were increased to highlight the lateralis central axons. All images are snapshots of lateral views from three-dimensional reconstructions. Dorsal is towards top, anterior is towards left. Scale bars = 30 μm. |
Expression Data
Expression Detail
Antibody Labeling
Phenotype Data
Phenotype Detail
Acknowledgments
This image is the copyrighted work of the attributed author or publisher, and
ZFIN has permission only to display this image to its users.
Additional permissions should be obtained from the applicable author or publisher of the image.
Full text @ Dev. Dyn.