|
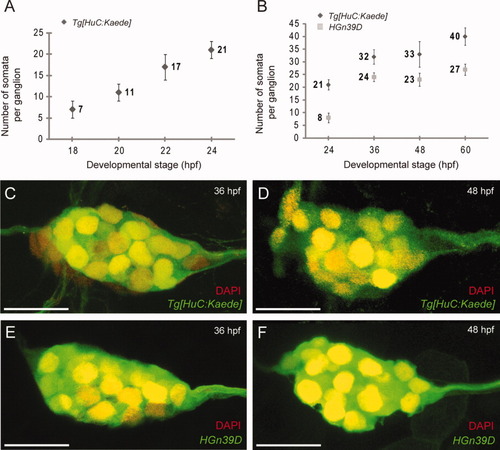
Progressive neurogenesis in the posterior lateralis ganglion. A: Average number of somata per posterior lateralis ganglion in the Tg[HuC:Kaede] transgenic line from 18 to 24 hpf, with a temporal resolution of 2 h (N=10). B: Comparison of the number of somata per posterior lateralis ganglion in the Tg[HuC:Kaede] and HGn39D transgenic lines, from 24 to 60 hpf, with a temporal resolution of 12 hr (N=4). Both show a progressive addition of neurons to the ganglion. Error bars indicate standard deviation. C-F: Maximal projections of Tg[HuC:Kaede] and HGn39D ganglia at 36 and 48 hpf. Tg[HuC:Kaede]green (C,D) and EGFP (E,F). Co-localization of the green and DAPI staining (red) signals fluoresces yellow. All images are lateral views. Dorsal is up, anterior is left. Scale bars = 20 μm.
|