
Fig. 2
- ID
- ZDB-FIG-100525-43
- Publication
- Arboleda-Estudillo et al., 2010 - Movement Directionality in Collective Migration of Germ Layer Progenitors
- Other Figures
- All Figure Page
- Back to All Figure Page
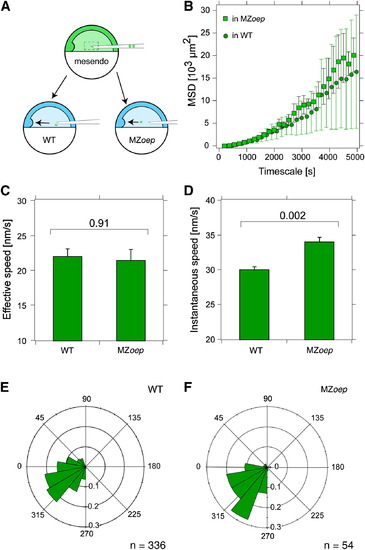
Movement of Individual Mesendoderm Cells in Wild-Type and MZoep Mutant Embryos (A) Schematic diagram of the cell transplantation experiment. One single mesendoderm cell was transplanted from a donor embryo into either wild-type (WT) or MZoep mutant host embryos at the onset of gastrulation (6 hpf). (B) Mean squared displacement (MSD) plot of individual mesendoderm donor cell movements in WT (circles) and MZoep (squares) host embryos. (C and D) Average effective (C) and instantaneous (D) speed of individual mesendoderm donor cell movements in WT and MZoep host embryos. (E and F) Movement orientation of individual mesendoderm donor cells in WT (E) and MZoep (F) host embryos. n represents number of analyzed cells. |
| Fish: | |
|---|---|
| Observed In: | |
| Stage Range: | Shield to 90%-epiboly |