
Fig. 5
- ID
- ZDB-FIG-100302-67
- Publication
- Arboleda-Estudillo et al., 2010 - Movement Directionality in Collective Migration of Germ Layer Progenitors
- Other Figures
- All Figure Page
- Back to All Figure Page
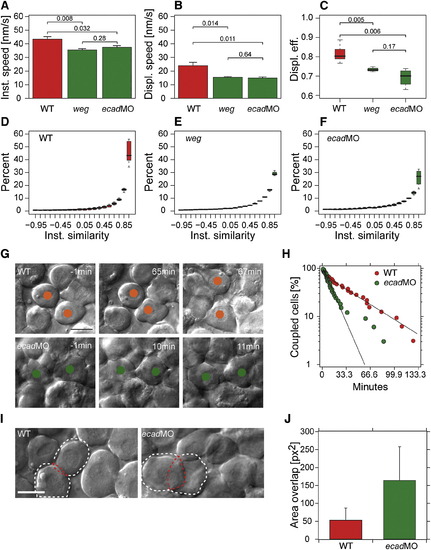
Movement of Lateral Mesendoderm Cells in e-cadherin Mutant and Morphant Embryos (A–C) Average instantaneous speed (A), average displacement speed (B), and displacement effectiveness (C) of mesendoderm progenitor cell movements during midgastrulation stages (7–9 hpf). Data of 6 wild-type (WT; red), 3 e-cadherin/weg mutant (weg; green), and 4 e-cadherin morphant (ecadMO; green; 4 ng per embryo) embryos are shown. Error bars in (A) and (B) represent the standard error of the mean, and in (C) the standard deviation. p values determined by t test are shown above the brackets. The average number of tracked cells per embryo is 390 ± 169 in WT, 403 ± 213 in mutant, and 380 ± 121 in morphant embryos. (D–F) Instantaneous similarity of neighboring mesendoderm progenitor movements within a maximum distance of 20 μm in WT (D), e-cadherin/weg mutant (E), and e-cadherin morphant (F) embryos. Values range from -1.0 (opposite direction of movement) over 0 (movement vectors are orthogonal) to +1 (parallel movement). Histograms were generated separately for each embryo. Box plots show the distribution of the bin heights among the different embryos. (G) Series of consecutive images from differential interference contrast (DIC) movies showing exemplary mesendoderm progenitor cell couplets in WT (red) and e-cadherin morphant embryos (green; 4 ng MO per embryo) from cell-cell contact formation (-1 min) to contact separation (67 min for WT and 11 min for morphant cells) during their migration at midgastrulation stages (7–9 hpf). Scale bar represents 16 μm. (H) Cumulated histogram of cell contact times of two mesendoderm cells in WT and e-cadherin morphant embryos (4 ng per embryo). Number of interacting cells decreases exponentially with higher contact time. Solid line represents a single-exponential decay with a mean contact survival time t = 12.5 ± 0.3 min and t = 28 ± 1.7 min for morphant (ecadMO) and WT cells, respectively. (I) DIC image outlining the overlap area of representative mesendoderm couplets in WT and e-cadherin morphant embryos (4 ng per embryo). Cell couplets are outlined with a white line and the overlap with a red line. Scale bar represents 18 μm. (J) Overlap area (outlined in I) between two mesendoderm cells in WT and e-cadherin morphant embryos. |
| Fish: | |
|---|---|
| Knockdown Reagent: | |
| Observed In: | |
| Stage Range: | Shield to 75%-epiboly |