
Fig. 5
- ID
- ZDB-FIG-100309-92
- Publication
- Patterson et al., 2010 - BMP regulation of myogenesis in zebrafish
- Other Figures
- All Figure Page
- Back to All Figure Page
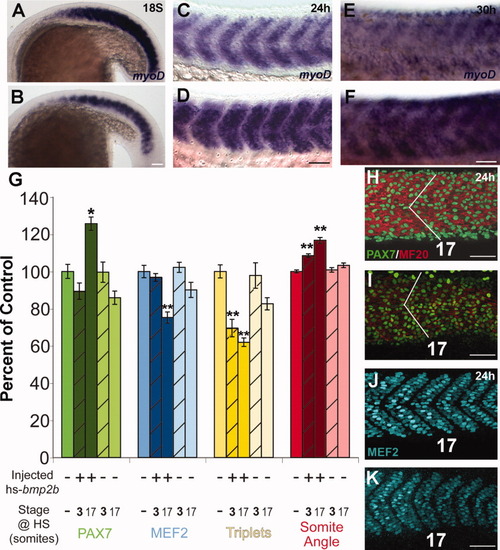
Differentiation of muscle following overexpression of Bmp2b. Differentiation of muscle following ectopic overexpression of Bmp2b. A, C, E: Normal differentiation of muscle. B, D, F: Differentiation of muscle in the presence of ectopic Bmp2b. A: Expression of myoD at the 18S stage in an embryo that was not injected or heat shocked. B: Expression of myoD at the 18S stage following heat-shock induction of Bmp2b at the 3S stage. The domain and expression level of myoD is reduced compared to the non-injected control embryos. C: Expression of myoD at the 24-hr stage in an embryo that was injected with the hs-bmp2b construct, but was not heat shocked. At 24 hr, myoD expression has begun to decrease in the somite as the cells differentiate into myosin-expressing fibers, and is present in a stripe in the anterior-posterior middle of the myotome. D: Expression of myoD at the 24-hr stage following heat shock induction of Bmp2b at the 3S stage. The domain of myoD is increased compared to non-heat-shocked control embryos and resembles the domain of expression in control 18S embryos. E: Expression of myoD at the 30-hr stage in an embryo that was injected with the hs-bmp2b construct, but was not heat shocked. F: Expression of myoD at the 30-hr stage following heat-shock induction of Bmp2b at the 3S stage. The level of myoD expression is higher than in non-heat-shocked control embryos, and appears similar to a 24-hr control embryo. G: Maturity assays for somite 17 after heat shock, compared to control. All measurements are expressed as a percentage of control (mean set to 100%). Measurements were: total number of Pax7+ cells (green bars), total number of MEF2+ cells (blue bars), total number of muscle fibers with triplet nuclei (yellow bars), and somite angle (red bars). Medium color bars (first in each set), control; dark bars, bmp2b-injected; light bars, non-injected. Bars for 3S heat-shocked embryos are hatched. *Significant difference from control at P < 0.001; **difference from control at P < 0.0001; lack of an asterisk indicates no statistical difference from control. A significant increase (∼25%) in Pax7+ cells was seen in bmp2b-injected 17S heat-shocked embryos (compare H and I), while all others were not different from control. A significant decrease (∼25%) was seen in MEF2+ cells in bmp2b-injected 17S heat-shocked embryos, while all others were not different from control (compare J and K). A significant decrease (20-40%) in number of fibers with triplet nuclei was seen in bmp2b-injected embryos when heat shocked at either 3S or 17S. A significant increase in somite angle (10-20%) was seen in bmp2b-injected heat shocked embryos at either 3S and 17S (compare angle in H and I). All error bars = standard error. N=10 for each group within each category. H-K: Changes in cell composition and morphology of somite 17 at the 24-hr stage in control (H,J) and hs-bmp2b-injected embryos heat shocked at stage 17 (number indicates somite number). H: Pax7 (green) and MF20 (red) antibody staining in a 24-hr stage control embryo. I: Pax7 (green) and MF20 (red) antibody staining in a hs-bmp2b-mCherry injected 17S heat-shocked embryo. Note the increase in both number of Pax7+ cells and somite angle (white lines). J: MEF2 antibody staining in a 24-hr stage control embryo (same individual as H). K: MEF2 antibody staining in a hs-bmp2b-mCherry-injected 17S heat-shocked embryo (same individual as I). Note the decrease in the number of MEF2+ cells. Scale bars = 50 μm. |