
Fig. 1
- ID
- ZDB-FIG-100309-88
- Publication
- Patterson et al., 2010 - BMP regulation of myogenesis in zebrafish
- Other Figures
- All Figure Page
- Back to All Figure Page
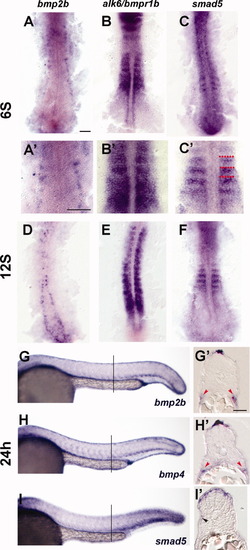
Expression of BMP pathway members in the trunk at 24 hr. A-C: Expression of BMP pathway members at 6S. D-F: Expression of BMP pathway members at 12S. G-I′: Expression of BMP pathway members at 24 hr. A: Expression of bmp2b at the 6S stage. Expression is in Rohon-Beard neurons. A′: Close-up of somites in A. B: Expression of alk6/bmpr1b is throughout the somite. B′: Close-up of somites in B. C: Expression of smad5 is in the anterior border cells (ABCs). C′: Close-up of somites in C, red dots indicate somite boundaries. D: bmp2b expression is found in Rohon-Beard cells, which have moved medially and dorsally. E: alk6/bmpr1b is expressed throughout the somites. F: Smad5 is expressed in the anterior-most cells in the newly formed somites, and more diffusely in older somites. G: Whole mount expression of bmp2b at 24 hr. Bmp2b is expressed in the dorsal and ventral trunk. G′: Transverse section of embryo labeled in whole mount for bmp2b. Bmp2b is expressed in the dorsalmost ectoderm, dorsal to the neural tube. Bmp2b is also expressed ventral to the myotome, in the presumptive lateral plate mesoderm (red arrowheads). H: Whole mount expression of bmp4 at 24 hr. Bmp4 is expressed in a pattern similar to the expression pattern of bmp2b. H′: Transverse section of embryo labeled in whole mount for bmp4. Bmp4 is expressed in the dorsal ectoderm and presumptive lateral plate (red arrowheads). I: Whole mount expression of Smad5 at 24 hr. Smad5 is expressed highly in the dorsal and ventral portions of the somite, especially in posterior somites. I′: Transverse section of embryo labeled in whole mount for smad5. High level of smad5 expression is evident in the dorsal somite, adjacent to the bmp-expressing domain. Some fainter-expressing cells are evident on the surface of the myotome (black arrowhead). Lines in F, G, and H indicate position of sections in each respective inset. Scale bars = 50 μm in A (for A-C, A′-C′); 25 μm in G′ (for G′-I′). |